Automate the work.Keep the receipts.
DjiniousWorkflow runs your operations as graphs: 330 nodes covering branches, loops, joins and human approval; databases, brokers, files and SaaS APIs; and models, where a model is the right tool. Every run is a document you can open — which node ran, what it produced, who approved it, and what it left behind.
- Build
- Run
- Watch
- Publish


One engine for the work that is too small for a service and too important for a spreadsheet
Most automation tools are a trigger, a list of steps and a log file. That is enough until the day a step fails halfway, a batch needs a person's signature, or somebody asks what the number on the dashboard was actually computed from. DjiniousWorkflow is built around those three questions rather than around the happy path.
A graph, not a script
branches · loops · joins · sub-workflowsFan a list out into one event per item, gather the results back, run two paths at once and join them, call another graph and wait for its answer. The structure is on the canvas, so the shape of the work is the first thing a new colleague sees.
330 nodes in the catalog
19 tools · one file eachFlow control, data shaping, dataframe verbs, sandboxed JavaScript, HTTP and GraphQL, LLM prompts and agents, entity CRUD — and connectors: SQL and document databases, object stores and files, brokers, notifications, and a long tail of SaaS APIs.
Runs you can watch
live, node by nodeA run draws itself: each node shows its state on the canvas as it executes, the log explains what happened, and a node's output opens full-page — sortable, filterable, chartable, exportable. Open a finished run a week later and the widgets are still there.
A person in the loop, properly
approvals are database rowsA graph can stop and wait for a decision. The pending approval is a row, not a held thread, so a run can sit on it for days across restarts and answer on whichever replica the person happens to reach. Rejection is a first-class path, not an error.
Pages a graph publishes
views · panels by keyA
views:*node writes into a saved page that outlives the run — a table, a chart, a metric, a map. Republishing replaces the data wherever the page has been arranged to put it, and every number on it traces back to a run you can open.Projects, artifacts and records
where the output goesGraphs live in projects with the resources they share: data, documents, files and links. A run can write a record into your own ontology, file a spreadsheet in the object store, or leave a link — each stamped with the run that produced it.
Build it, fire it, watch it, and leave something behind
The four stages are not a methodology, they are the four screens. What separates this from a job runner is that each stage is a thing you can open afterwards: the graph, the run, the node's output, and the page it published.
Build
Drag a node from the catalog, wire it, and set its parameters in the inspector. Every parameter accepts an expression, so a value can come from the payload, the run context, the loop counter or another node — and a node that needs a credential names one rather than holding it.
- 330 nodes across 19 tools, searchable by name or category
- Expressions everywhere: {{$input.total}}, {{$merged[1].id}}, {{$settings.region}}
- A node you need but the catalog does not have is built in the app, not in a fork
- Validation is live: the header says whether the graph is runnable, and why not


Run
Fire it by hand, on a cron schedule, from an inbound webhook, from the REST API, from another graph, or from an agent over MCP. Every route ends in the same queue, and every run records which one it was.
- Cron schedules with a timezone, claimed so exactly one replica fires each occurrence
- Inbound webhooks with a per-trigger token
- One graph can call another and wait for its result — decomposition, not duplication
- Retries with exponential backoff, and an error branch when the retries are spent


Watch
The run monitor draws the graph as it executes: a spinner while a node works, a check with its repetition count, a red mark carrying the failure message. Nodes that publish a widget draw it in place, and the log dock explains the rest.
- Live over a websocket, and polled as well — the socket is a latency optimisation, never the source of truth
- A node's output opens full-page: sort, filter, chart, profile, export to CSV
- Pause, step, stop, or fire a single node by hand while the run is live
- An approval waiting on a person appears in the rail, with the payload it is asking about


Publish
A graph that only logs is a graph nobody reads. These publish: a page of panels, a record in your own ontology, a file in the project, a notification, a webhook out. Each one is addressed by name, so the next run replaces it rather than piling up beside it.
- Views: tables, charts, metrics, markdown and maps, arranged by whoever reads them
- Entities: records in the ontology you defined, stamped with the run that wrote them
- Artifacts: values, documents and real files — bytes go to object storage, small payloads stay in the database
- Notifications in-app, and outbound webhooks for everything else


There is no run state in the process
The queue of what to do next, a join's partial arrivals, a suspended approval, a repeating timer — every one of them is a row. A process contributes a worker loop and nothing else, which is what makes the two questions people actually ask have boring answers: what happens when a node dies mid-run, and how do we make it go faster.
- A worker that dies has its lease expire, and its work is picked up by another
- Scaling out is running more replicas: they share one queue and split the work
- Delivery is at-least-once, and the engine says so rather than implying exactly-once
- A gather's arrivals are rows, not an array on one record, so a wide fan-out never contends
Most of this engine's failure modes need two nodes racing to appear at all, so the test suite is run with a second replica attached before an engine change ships. The gather rules that look like defensive noise are each a bug that took a forty-way fan-out to find.
A model reads the ticket. The rules route it.
Language models are good at reading prose and bad at being audited. So a model classifies the ticket, drafts the status update, or reads a table and writes the sentence that goes beside it — and the queue, the SLA, the threshold and the approval stay in nodes a support lead can read and change.
- Prompt, extract-to-a-schema, classify-to-a-label, or a tool-calling agent — four nodes, one catalog
- Every AI node has an error branch, and the graphs that ship with the product use it
- The assistant can author and run graphs for you, over the same API you have
- Bring your own endpoint: Anthropic, OpenAI, Ollama, or anything OpenAI-compatible you host


Six departments, eighteen graphs, all of them runnable
These ship with the product. One command seeds them, another runs them, and every screenshot on this site came out of those runs. Each graph reads a fixture where your deployment would read a database — swap the node at the top and the rest of the graph does not change.


- Fan-out · branch and join · scheduled
Revenue operations
Inbound leads scored and routed in seconds, the pipeline swept every night, and a revenue page that rebuilds itself before the Monday meeting.
flow:forEachflow:collectflow:mergeviews:*ai:promptEvery lead is scored on its own event, so a batch of twelve is twelve independent pieces of work that the engine gathers back into one answer. Above the bar the lead goes to an AE with a fifteen-minute SLA; below it, to lifecycle marketing. Both paths write a record. The nightly sweep asks three questions of the pipeline at once — untouched, no next step, past its close date — and merges the three answers with an
alljoin, which fires once wherever the branches happened to land.- One event per lead: score, route, record, gather — none of it in a loop you wrote
- Three filters running concurrently, merged by a join whose state lives in the database
- A Monday-morning review that publishes four panels and a written commentary
- The commentary node has an error branch, so the page is built even when the model is not reachable
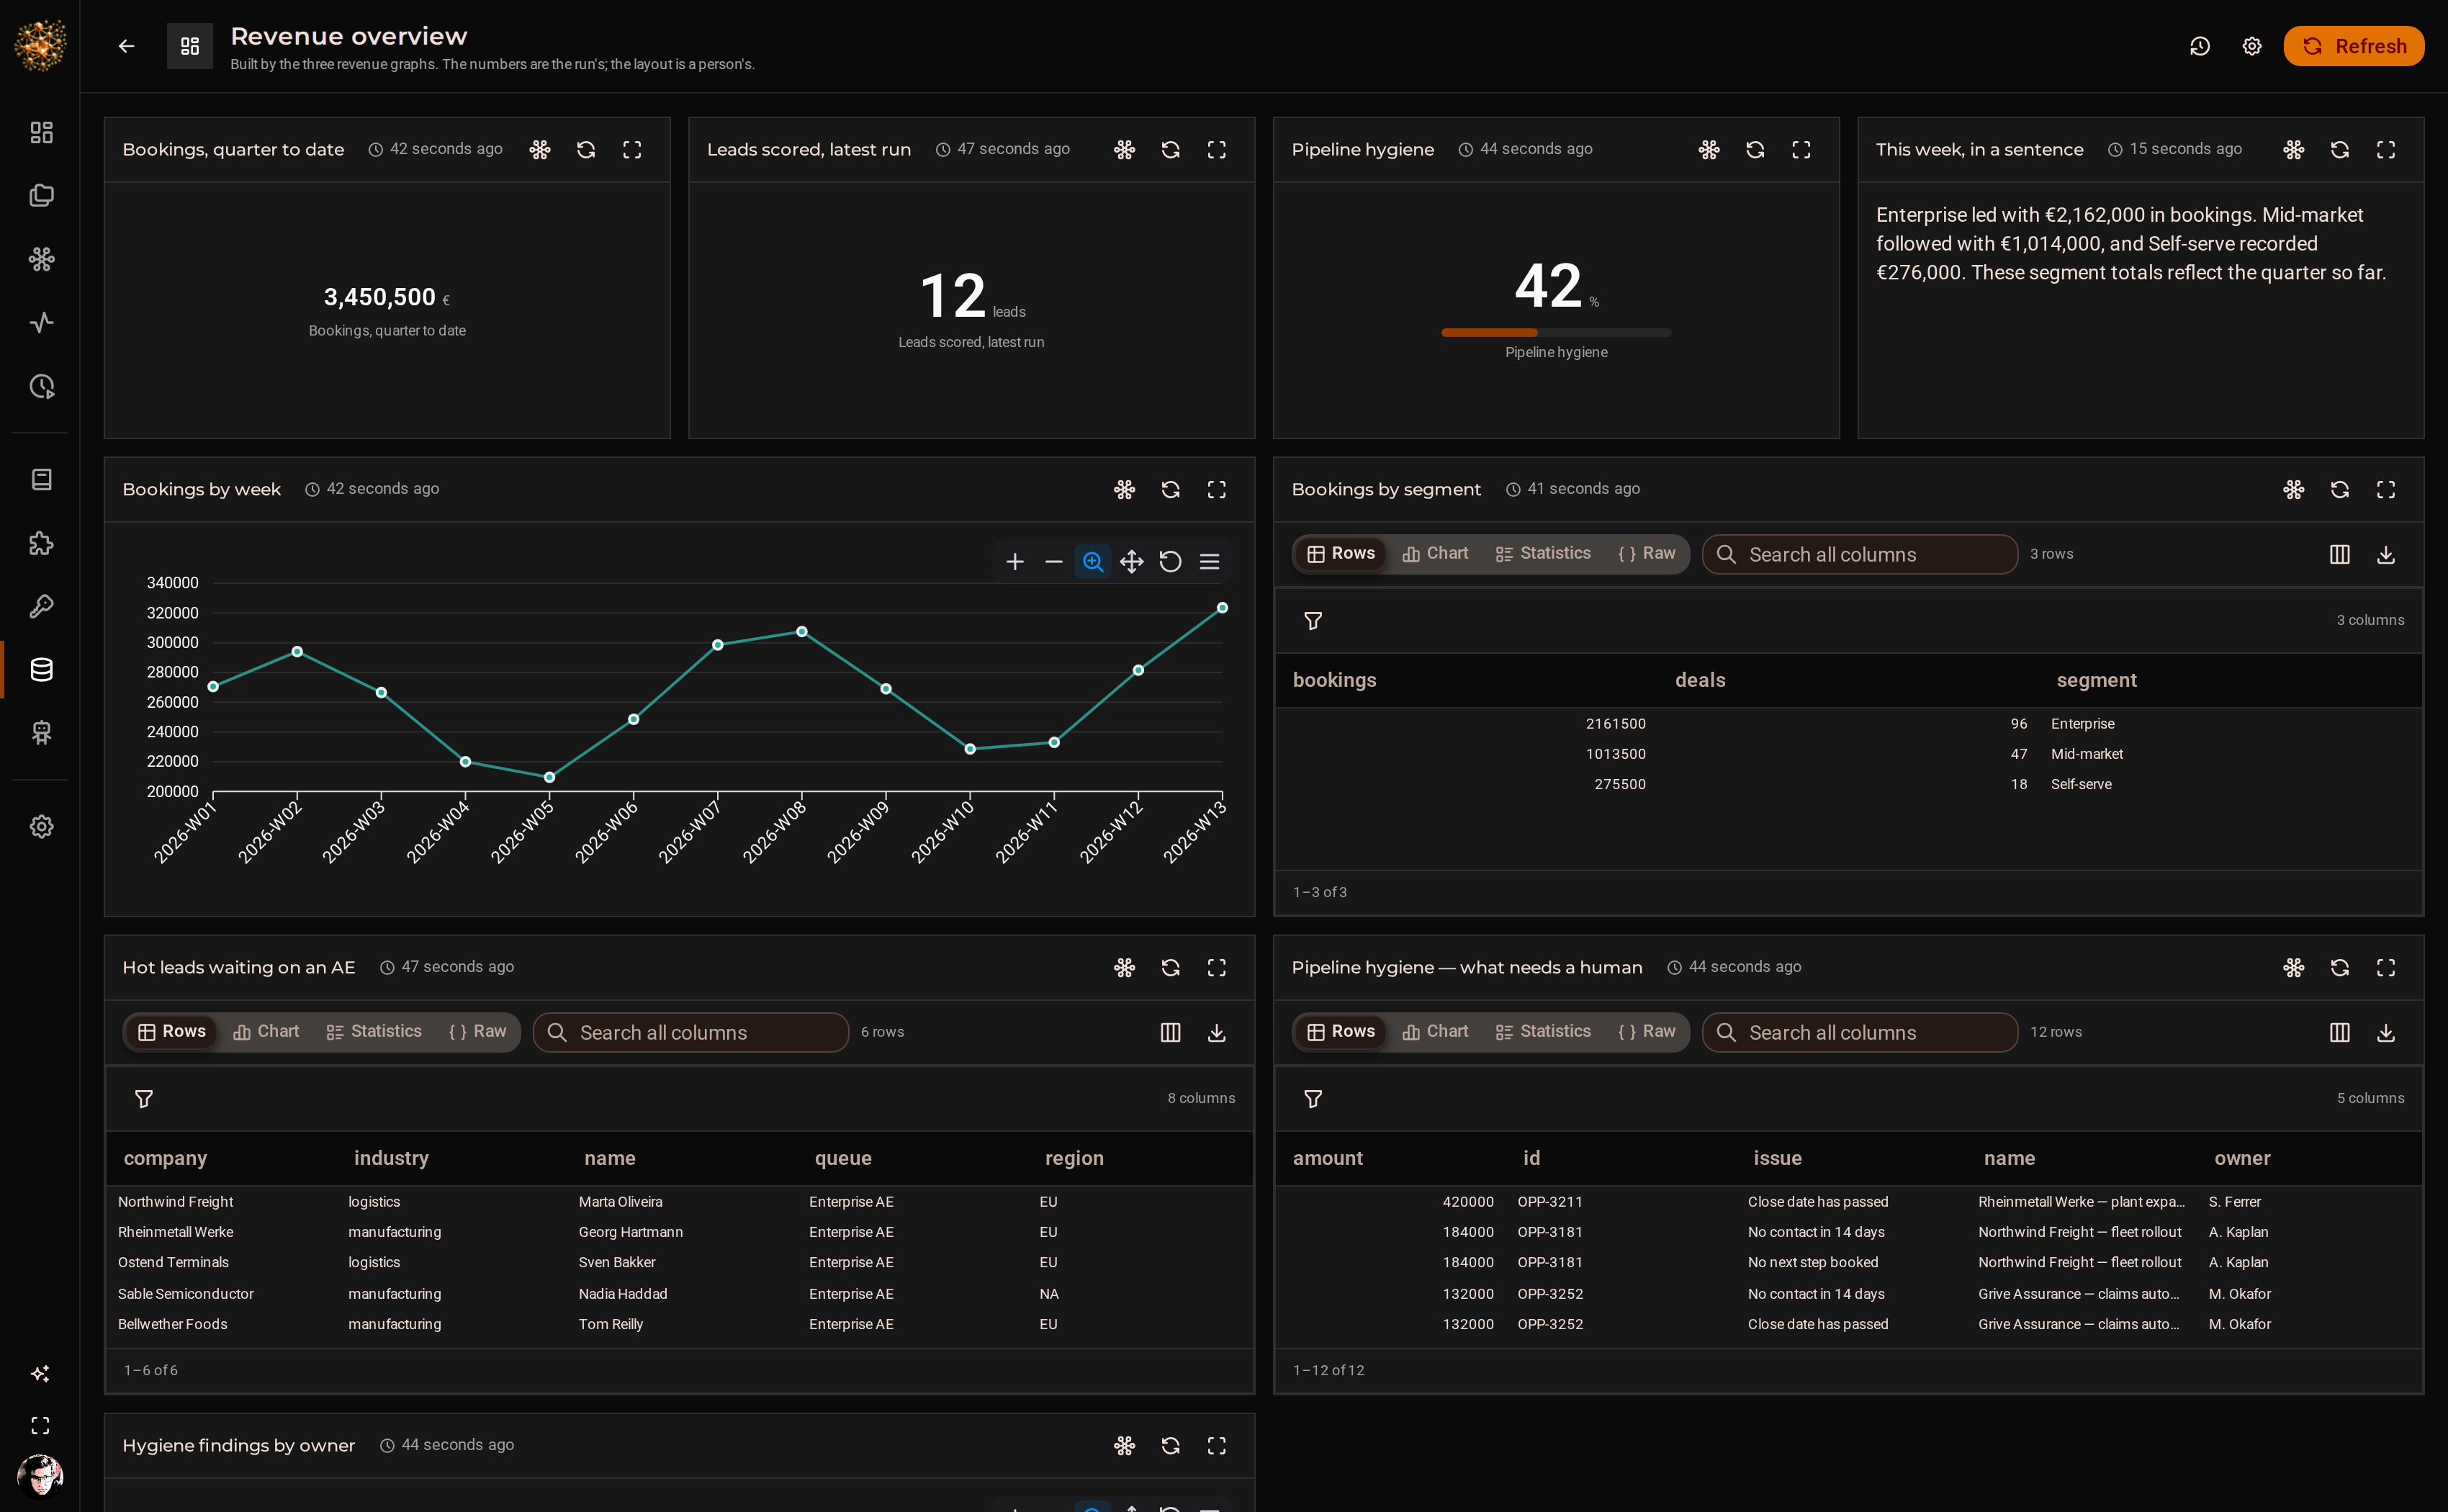
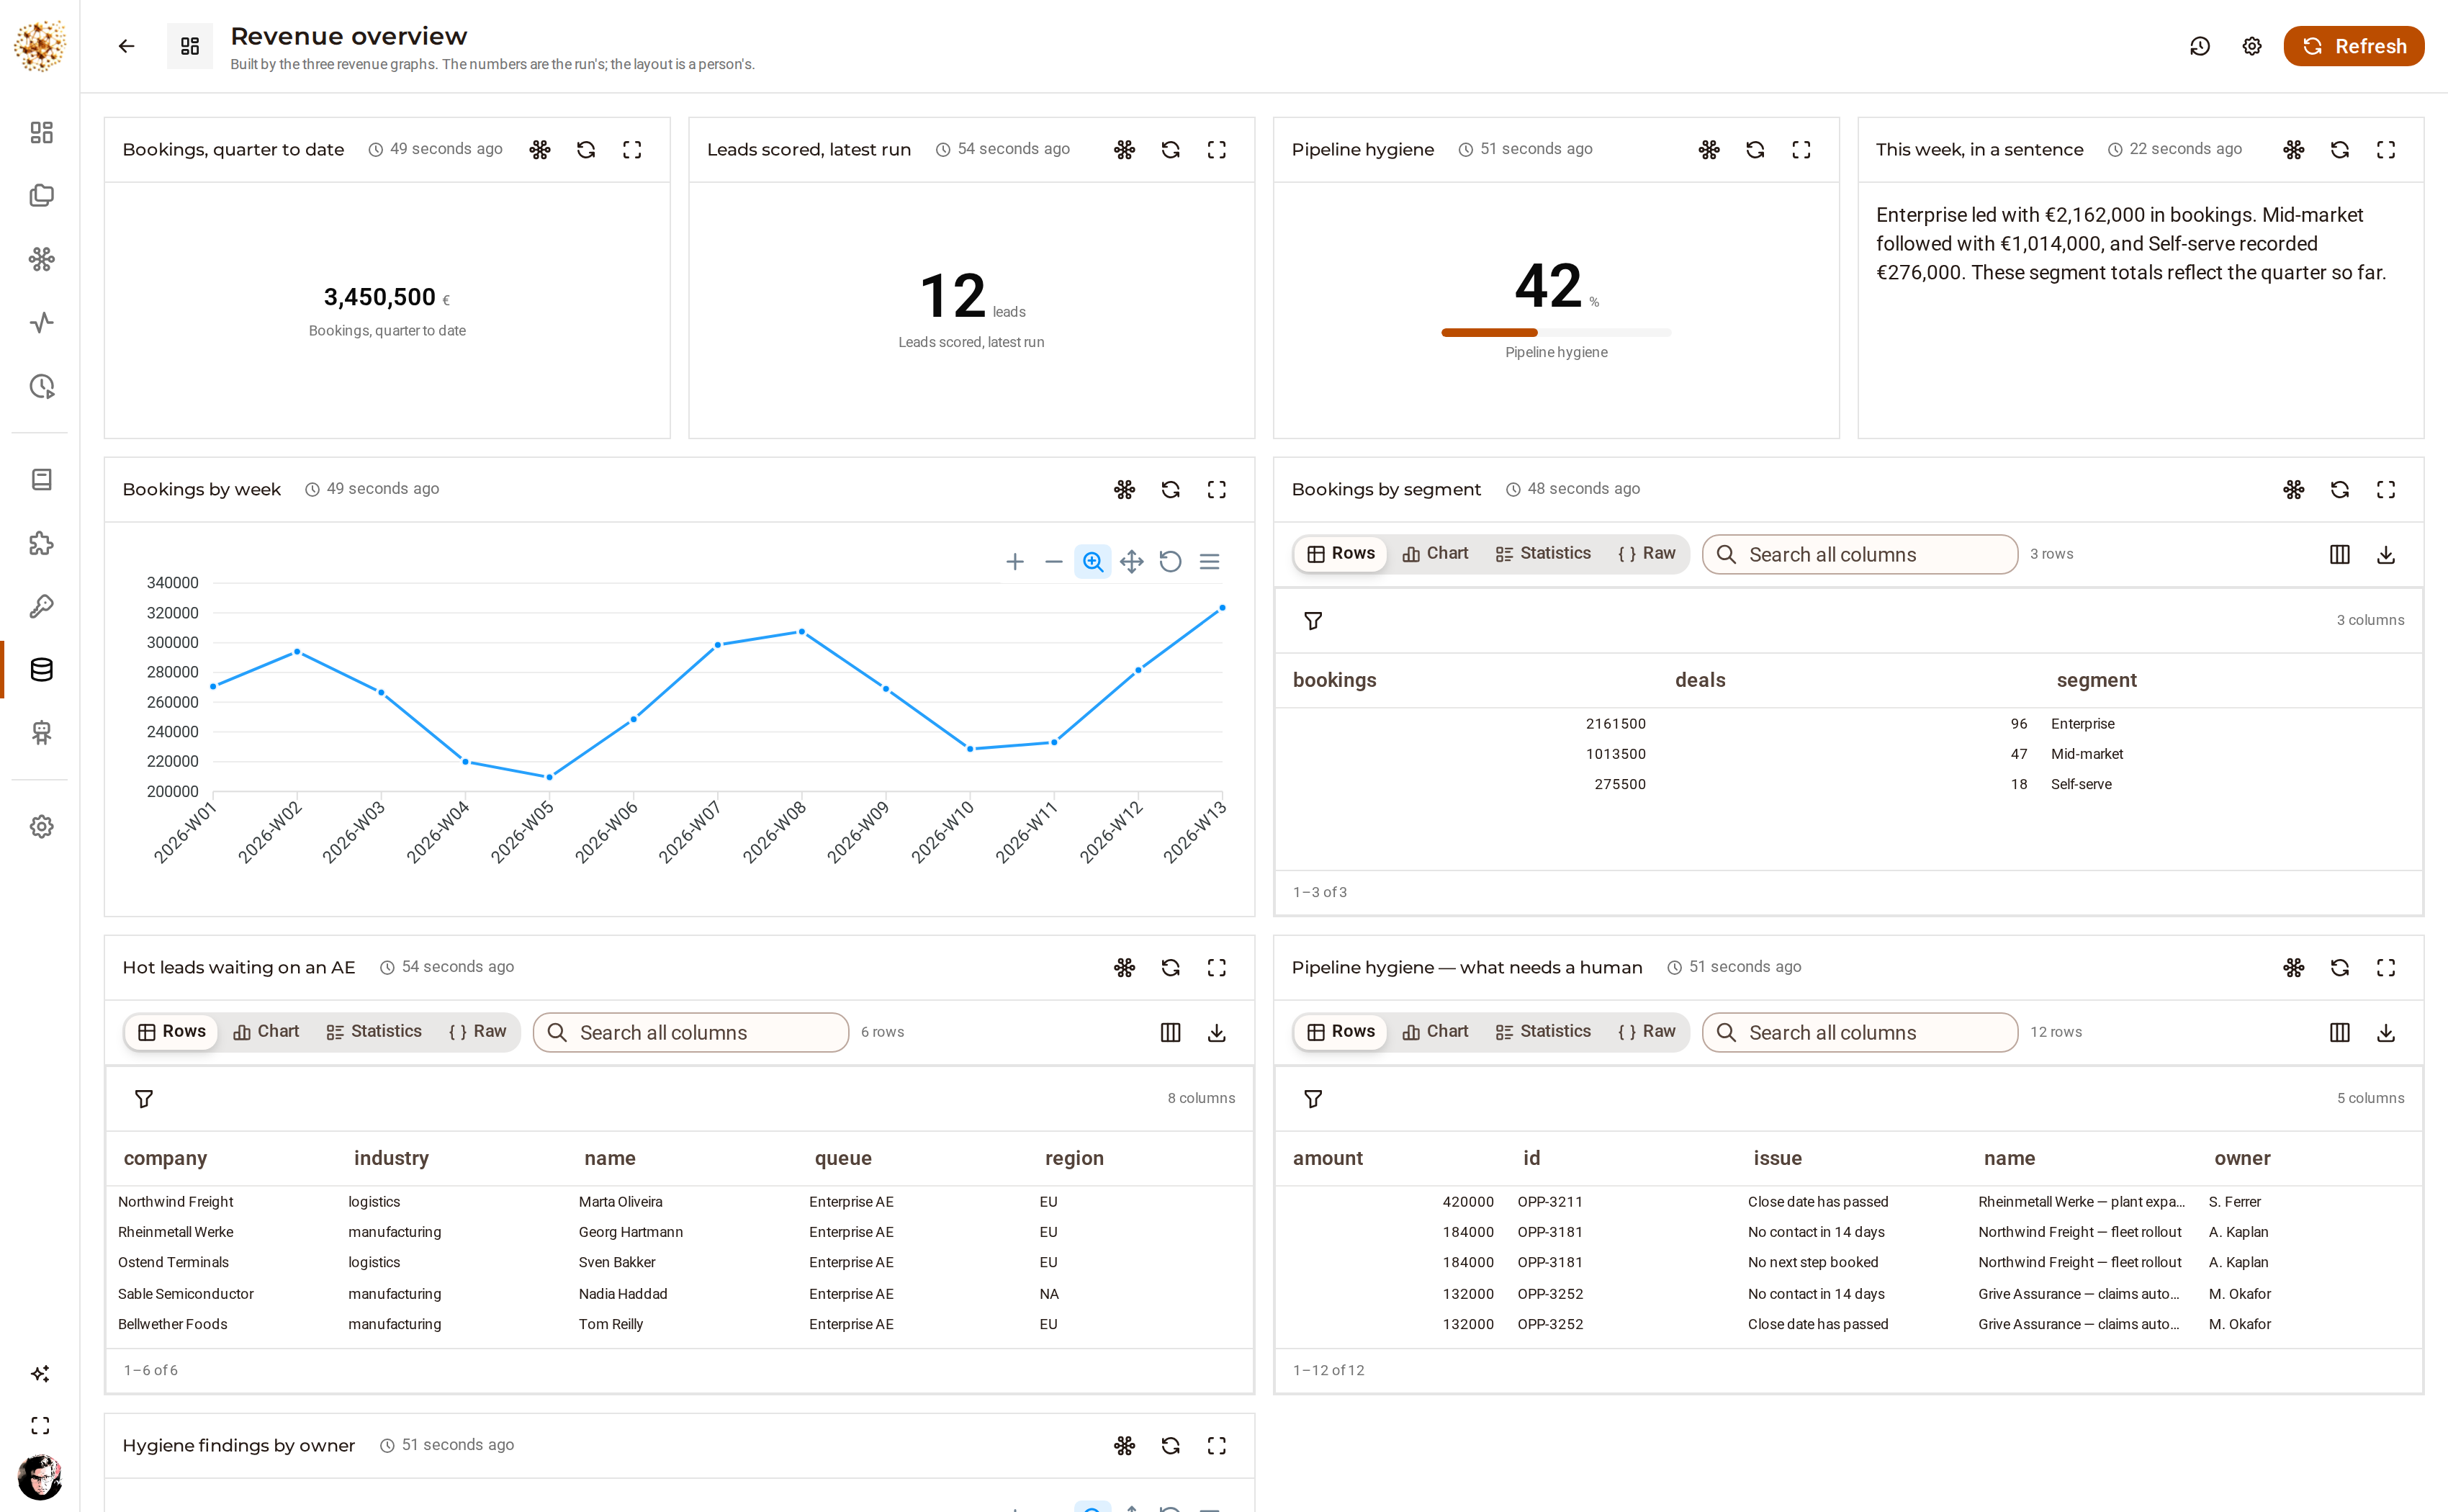
One page, three graphs, and a paragraph the model wrote about numbers the graph computed.Seeded showcase project - Webhook · classification · SLA clock
Customer support
A model reads every ticket, rules do the routing, the clock is watched every quarter hour, and Friday's digest writes itself.
ai:classifyflow:switchentities:createnotify:*SchedulesThe ticket arrives on a webhook. A model classifies it — billing, bug, how-to, churn risk — and everything after that decision is ordinary graph: priority from the plan and the category, a queue, an SLA, a record, a page for whoever has to answer it. The classifier's error branch is a keyword rule set, because a triage queue that stops when an inference endpoint has a bad afternoon is not a triage queue you put in front of customers. Every record says which of the two labelled it.
- Inbound webhook with its own token, per trigger
- ai:classify with a retry, and a rule-based fallback on its error branch
- A switch with four outputs, and the SLA each queue carries stated in the node
- Every fifteen minutes: what is late, what is about to be, and whose queue it is in
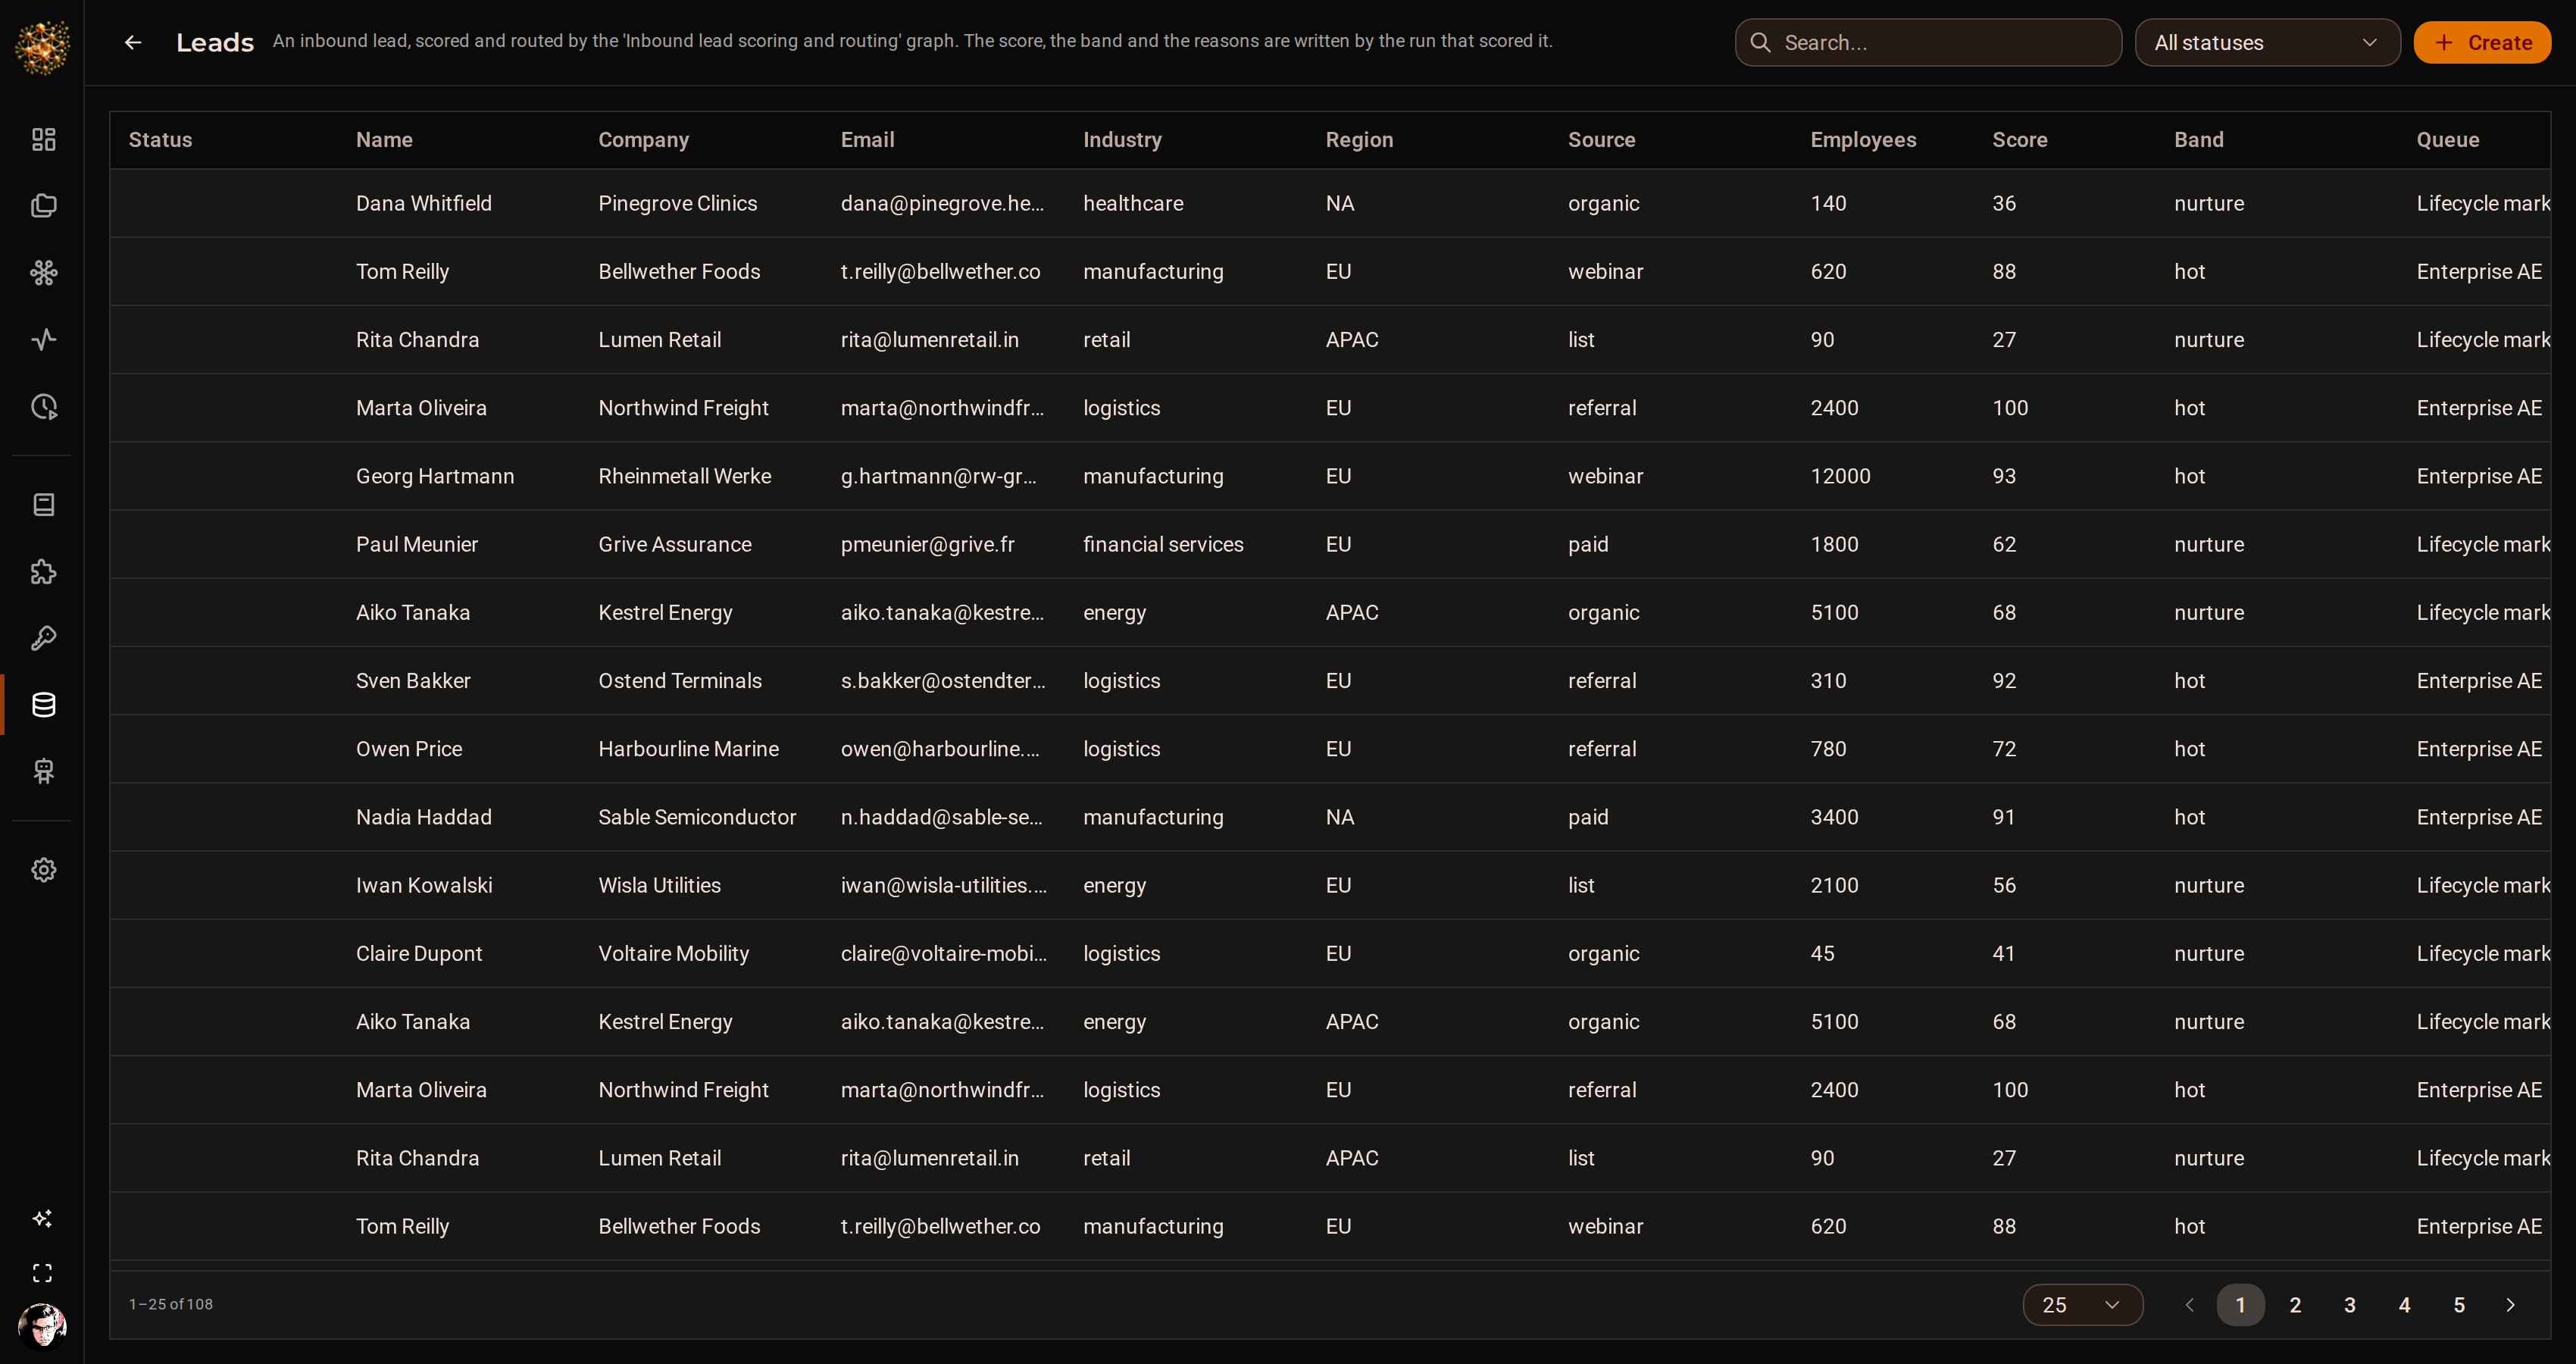
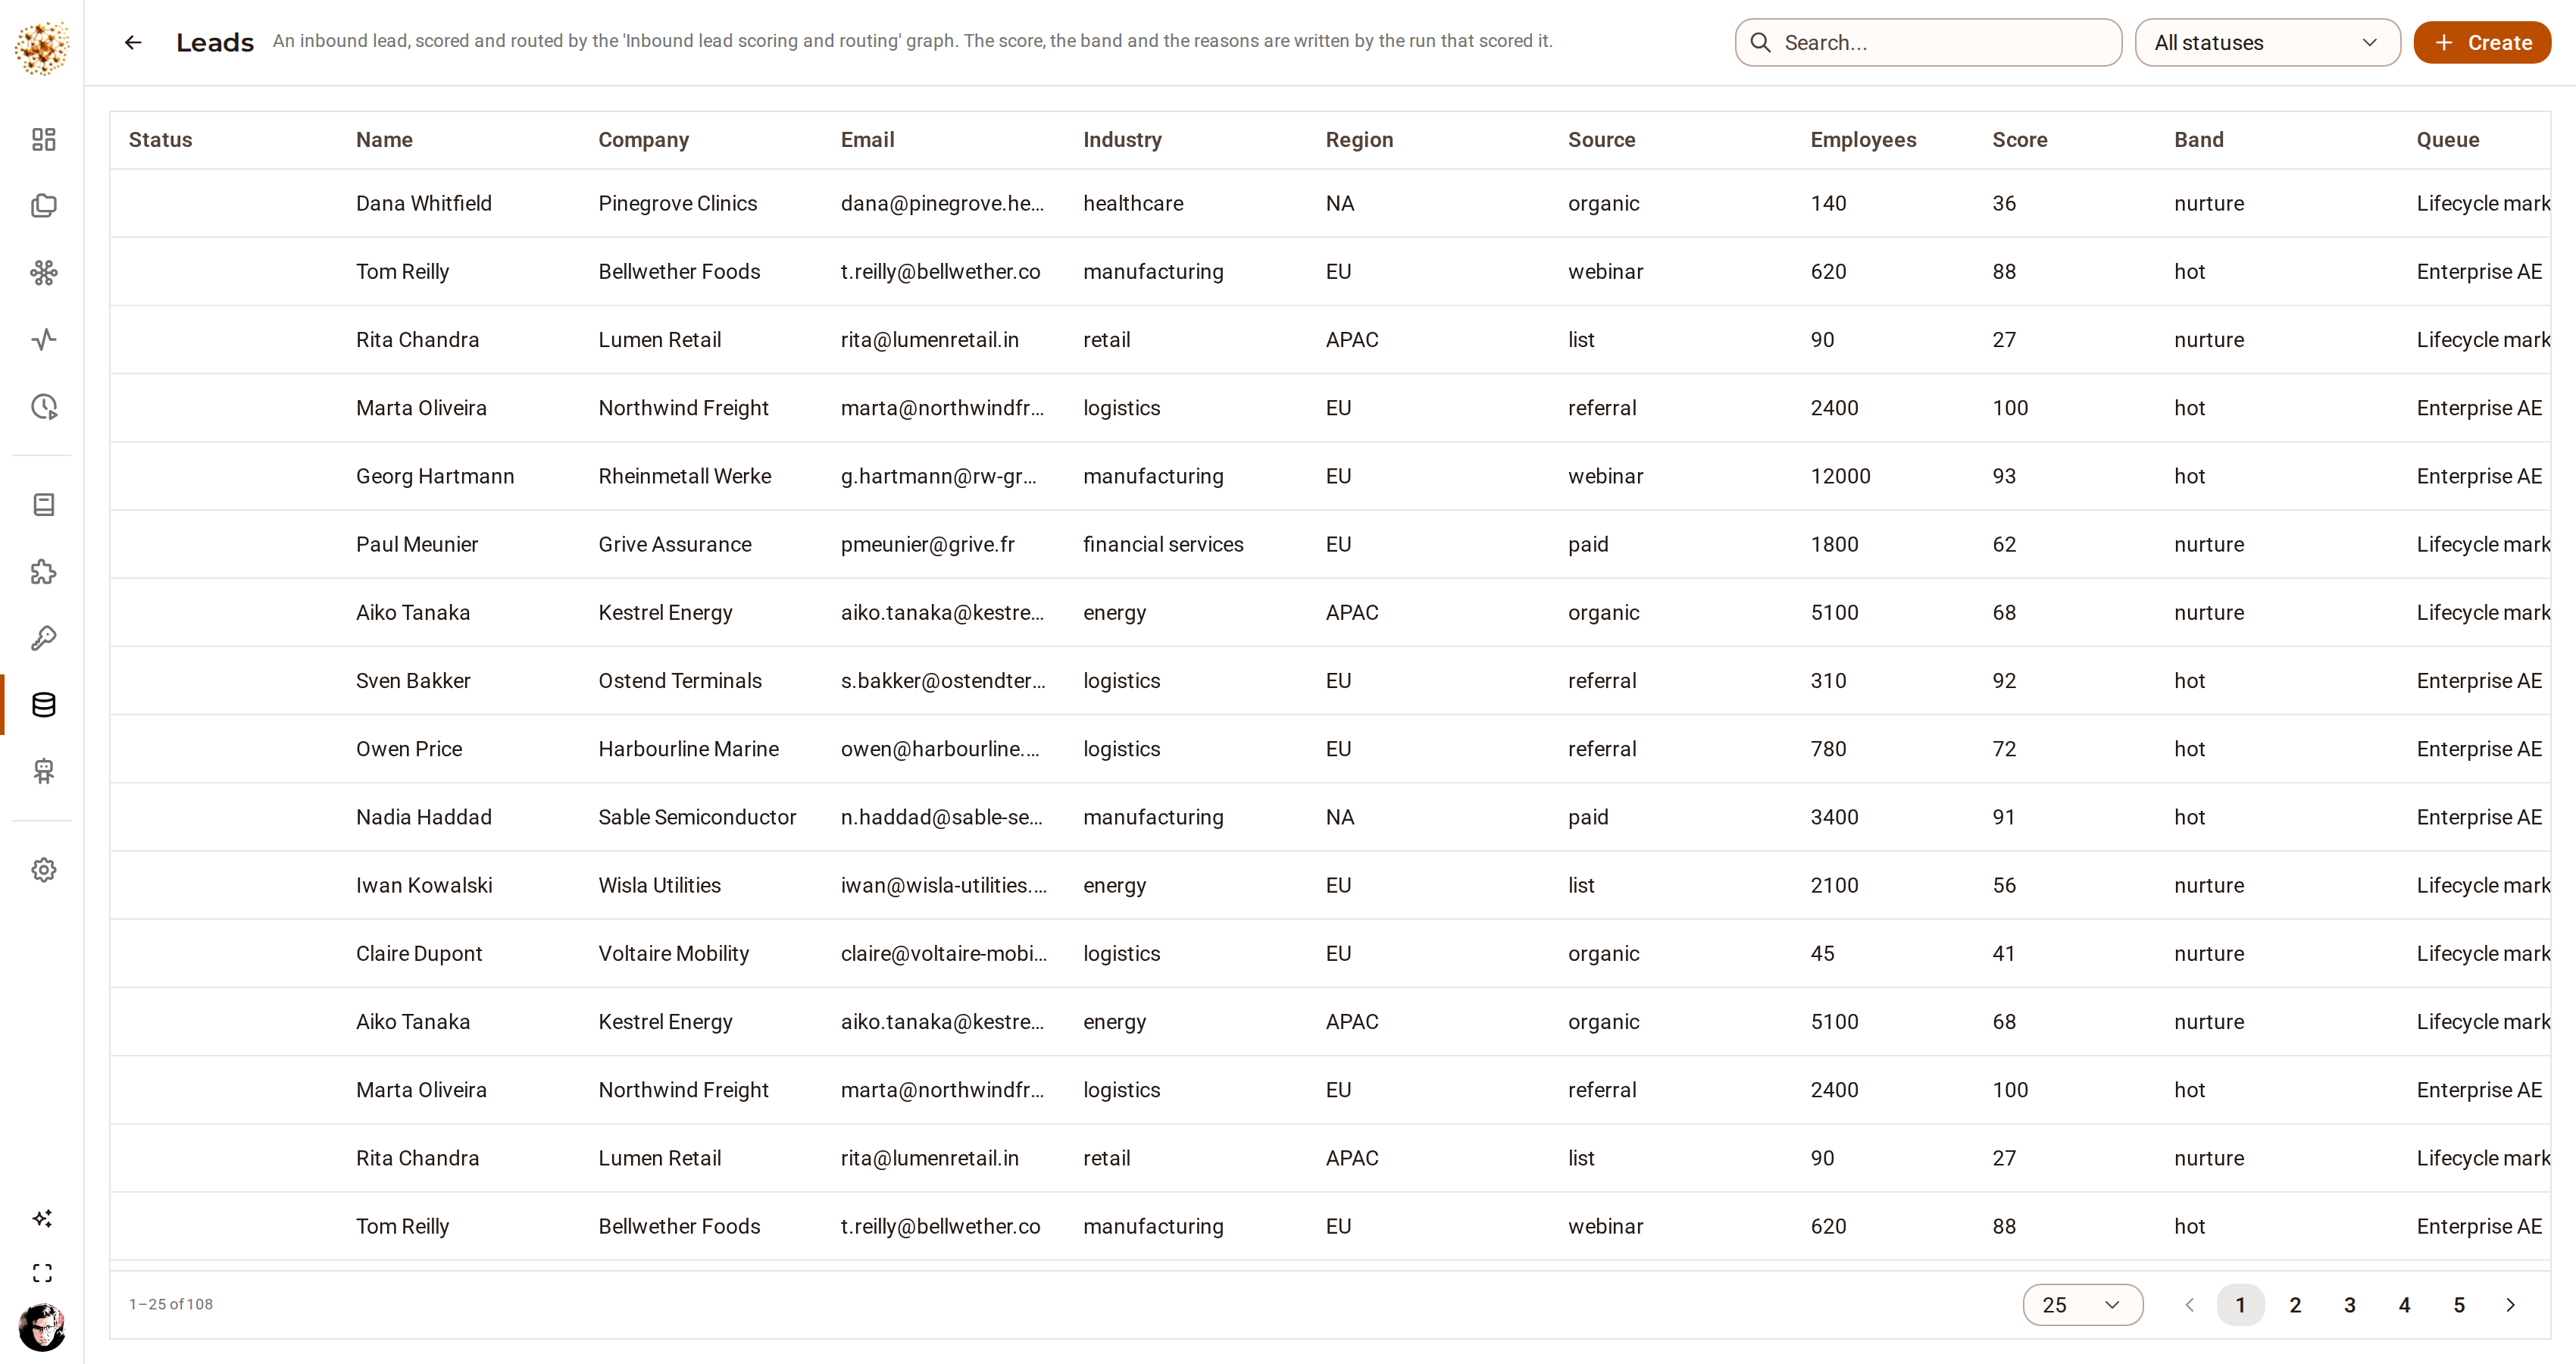
Records written by a run, in an ontology you defined. Each one carries the id of the run that wrote it.Seeded showcase project - Retries · error branches · human gate
Site reliability
Endpoints probed in parallel, incidents opened by the failure itself, and nothing reaching a public status page without a person approving the words.
http:get__output_errorflow:approvesql:sqlite*views:metricThe probe graph deliberately watches an endpoint that does not resolve. It retries twice with backoff, leaves by the error branch, opens an incident record and pages the owning team — and the run still finishes green with the two healthy checks reported, because that is what the graph says should happen. The intake graph routes an alert by severity, has a model draft the customer-facing sentence, and then stops: the approval is a database row, so the run waits for as long as the decision takes.
- One check per endpoint, fanned out, with retries and backoff on each
- A failure that becomes an incident record and a page, not a dead run
- Severity routing, a drafted status update, and a person between the draft and the public
- The month's error budget read back out of a real database, with the SQL in the node
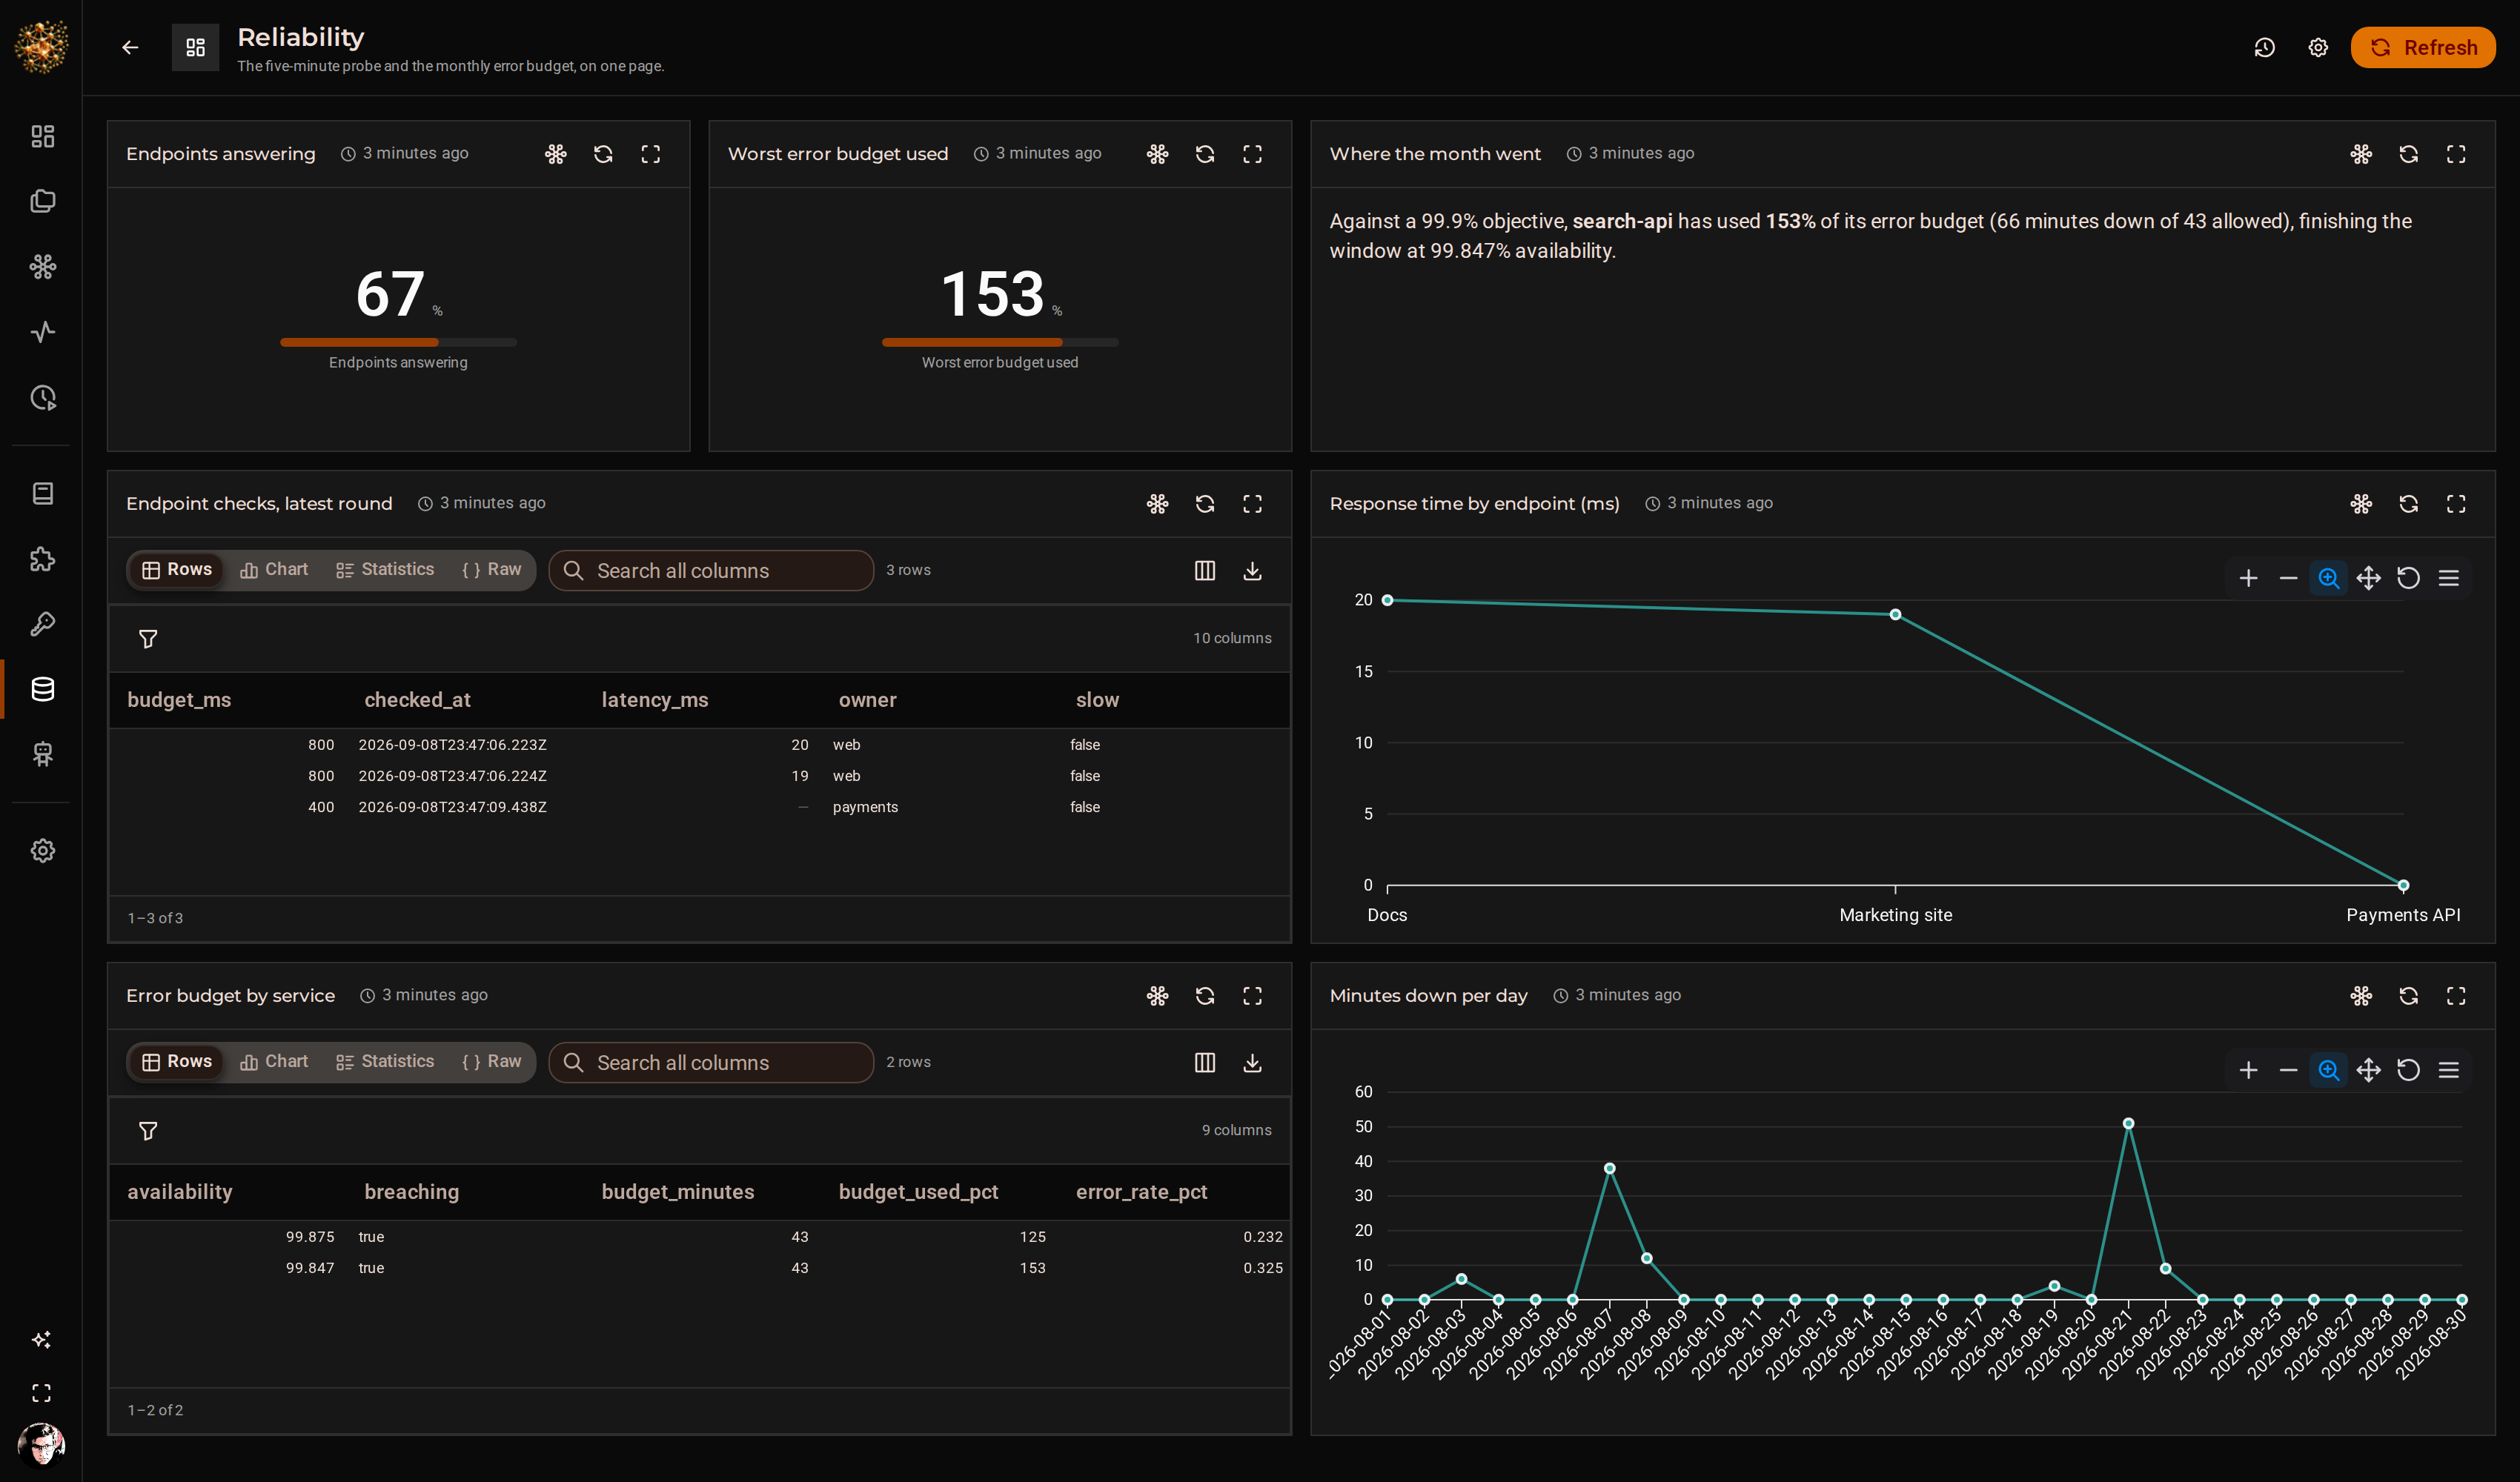
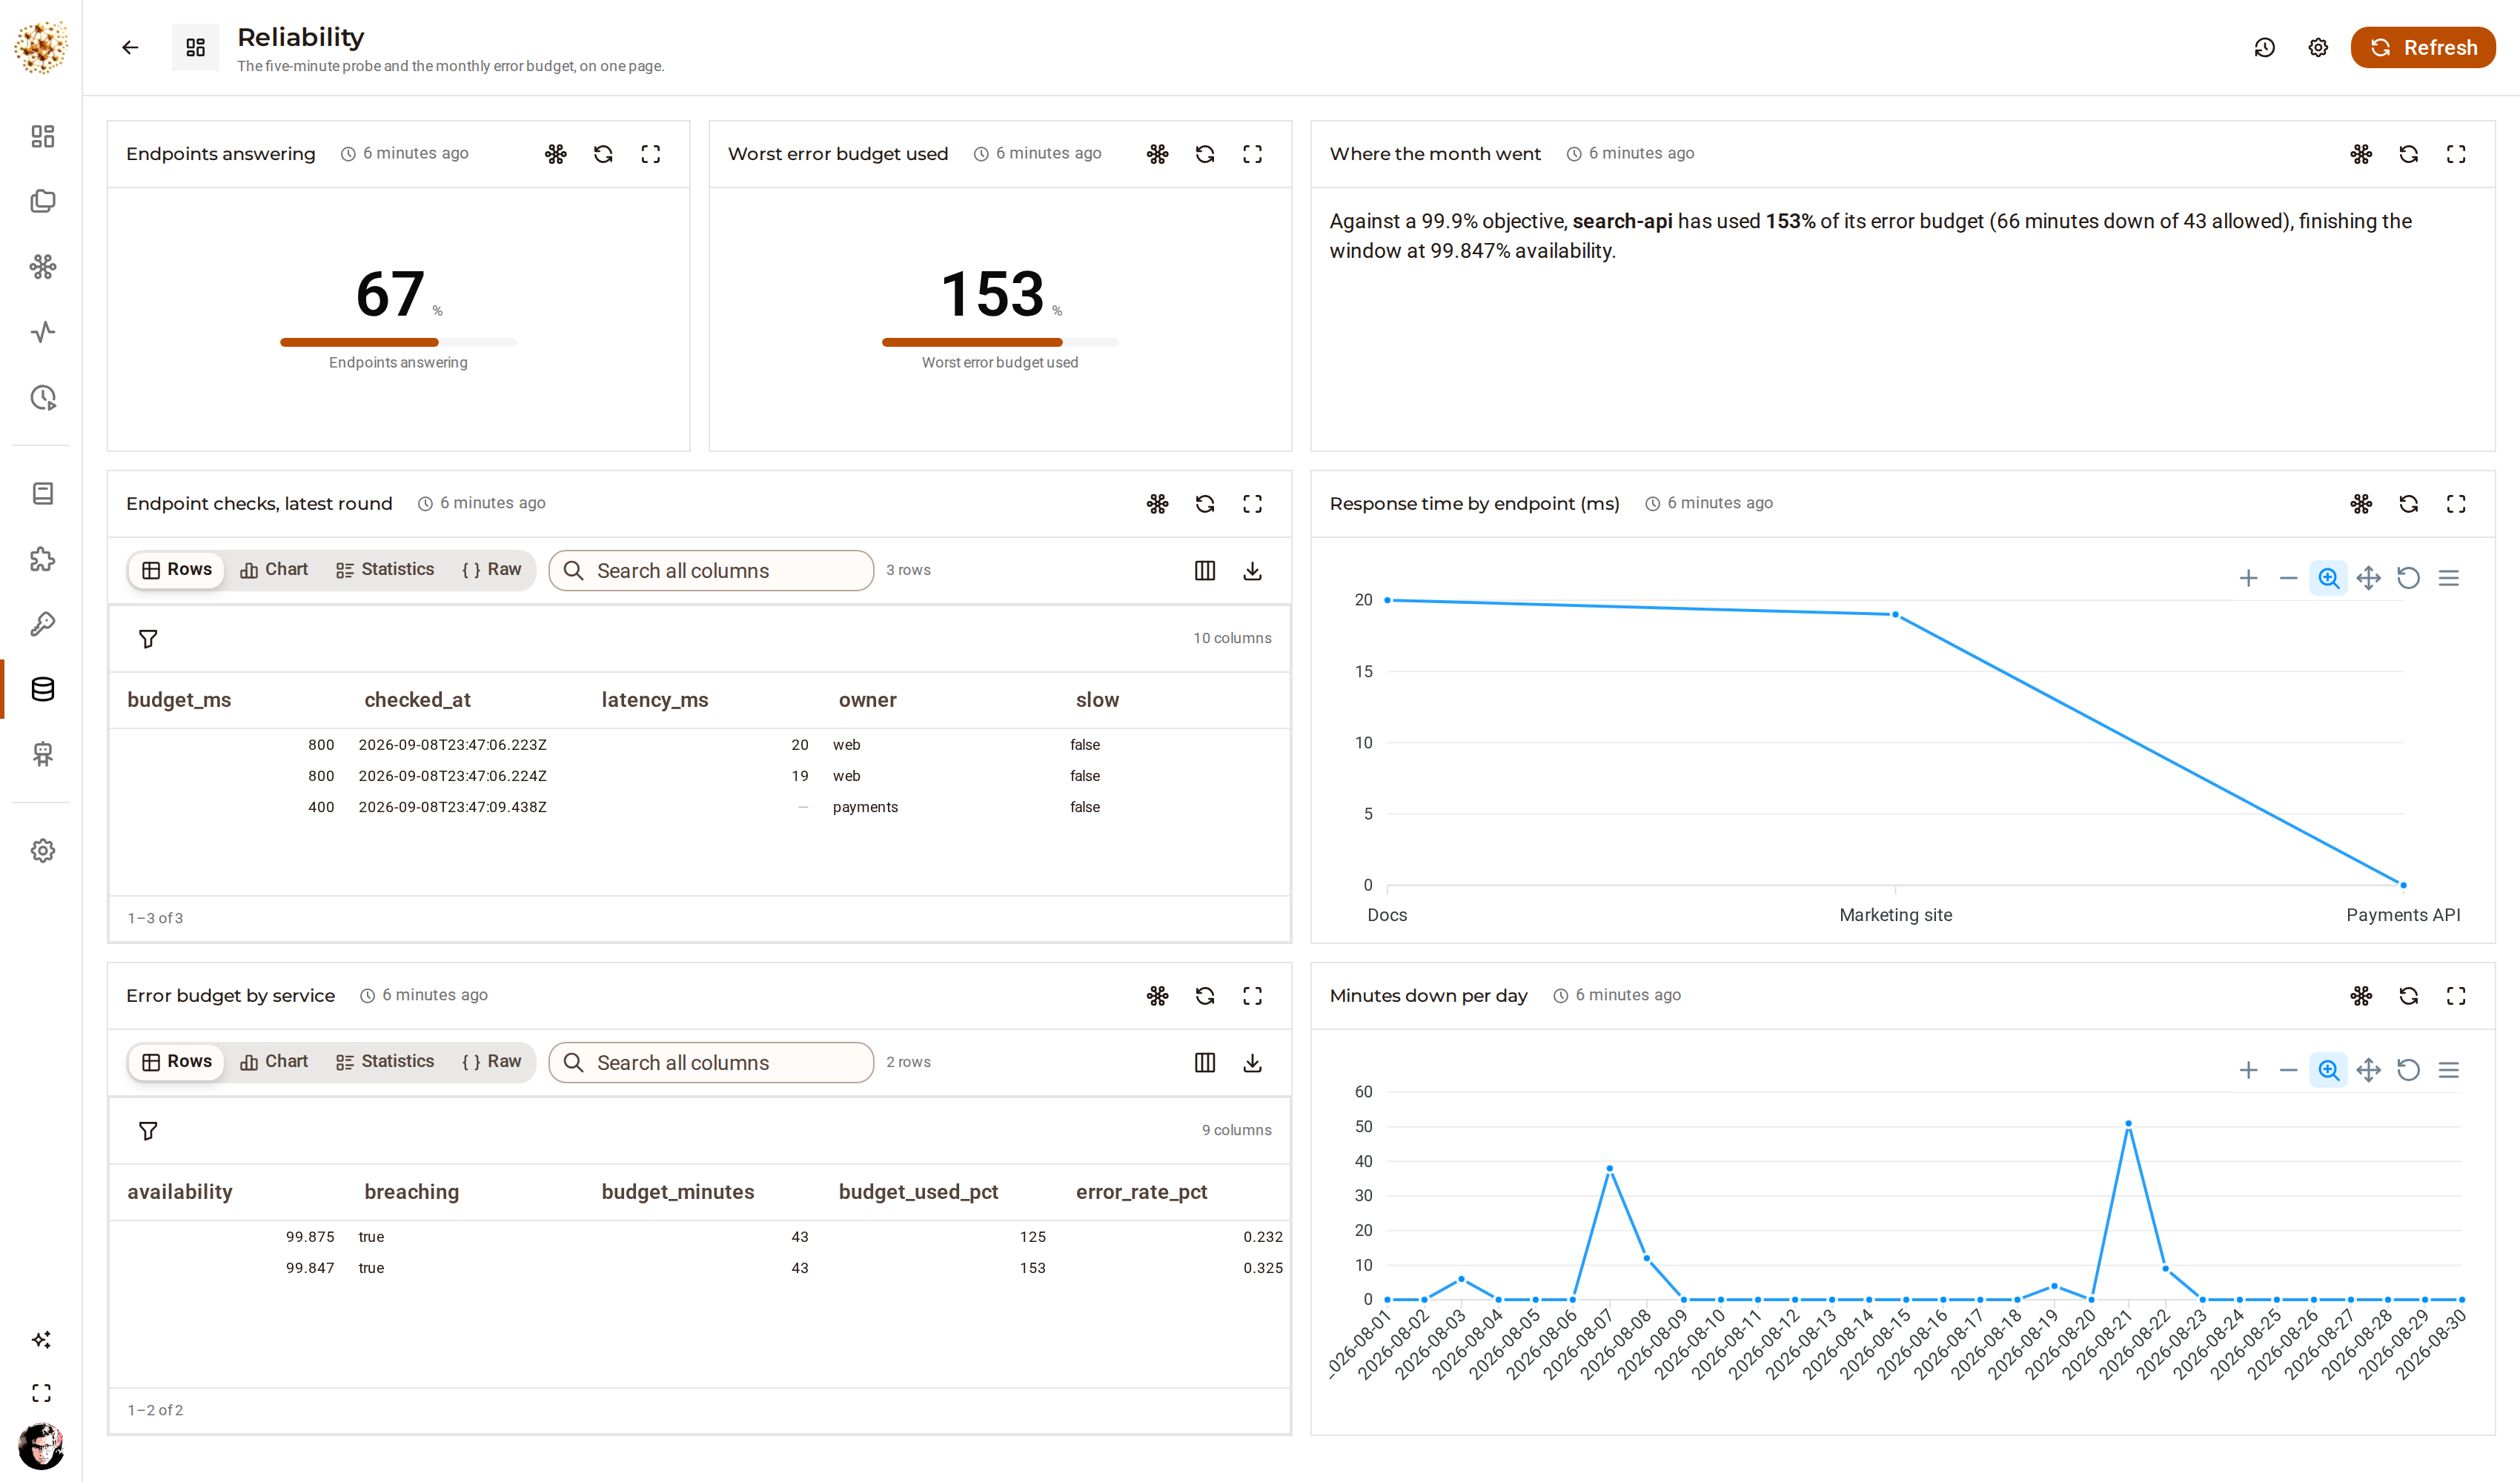
The five-minute probe and the monthly error budget on one page — the probe's failed endpoint included, because that is the number somebody needs.Seeded showcase project - Sub-workflows · delegated limits
Finance operations
Invoices matched one child run each, exceptions explained rather than listed, and nothing above the delegated limit released without a signature.
flow:callWorkflowflow:approvefiles:toXlsxartifacts:putThe batch graph does not know how to match an invoice. It fans the morning's invoices out and calls a second graph once per invoice — which is what decomposition looks like here: the matching rules are one small graph a finance analyst can open, run against a single invoice, and change, without touching the machinery around it. Then the money stops. Above the delegated limit the run parks on an approval; the payment file is written after the release, never beside it, so a rejected batch leaves nothing behind.
- One child run per invoice, the parent suspended in the database rather than holding threads
- A three-way match with its tolerances stated at the top of the node
- An approval gate above the delegated limit, with rejection wired as a normal outcome
- A close pack that files an actual .xlsx in the project's object store
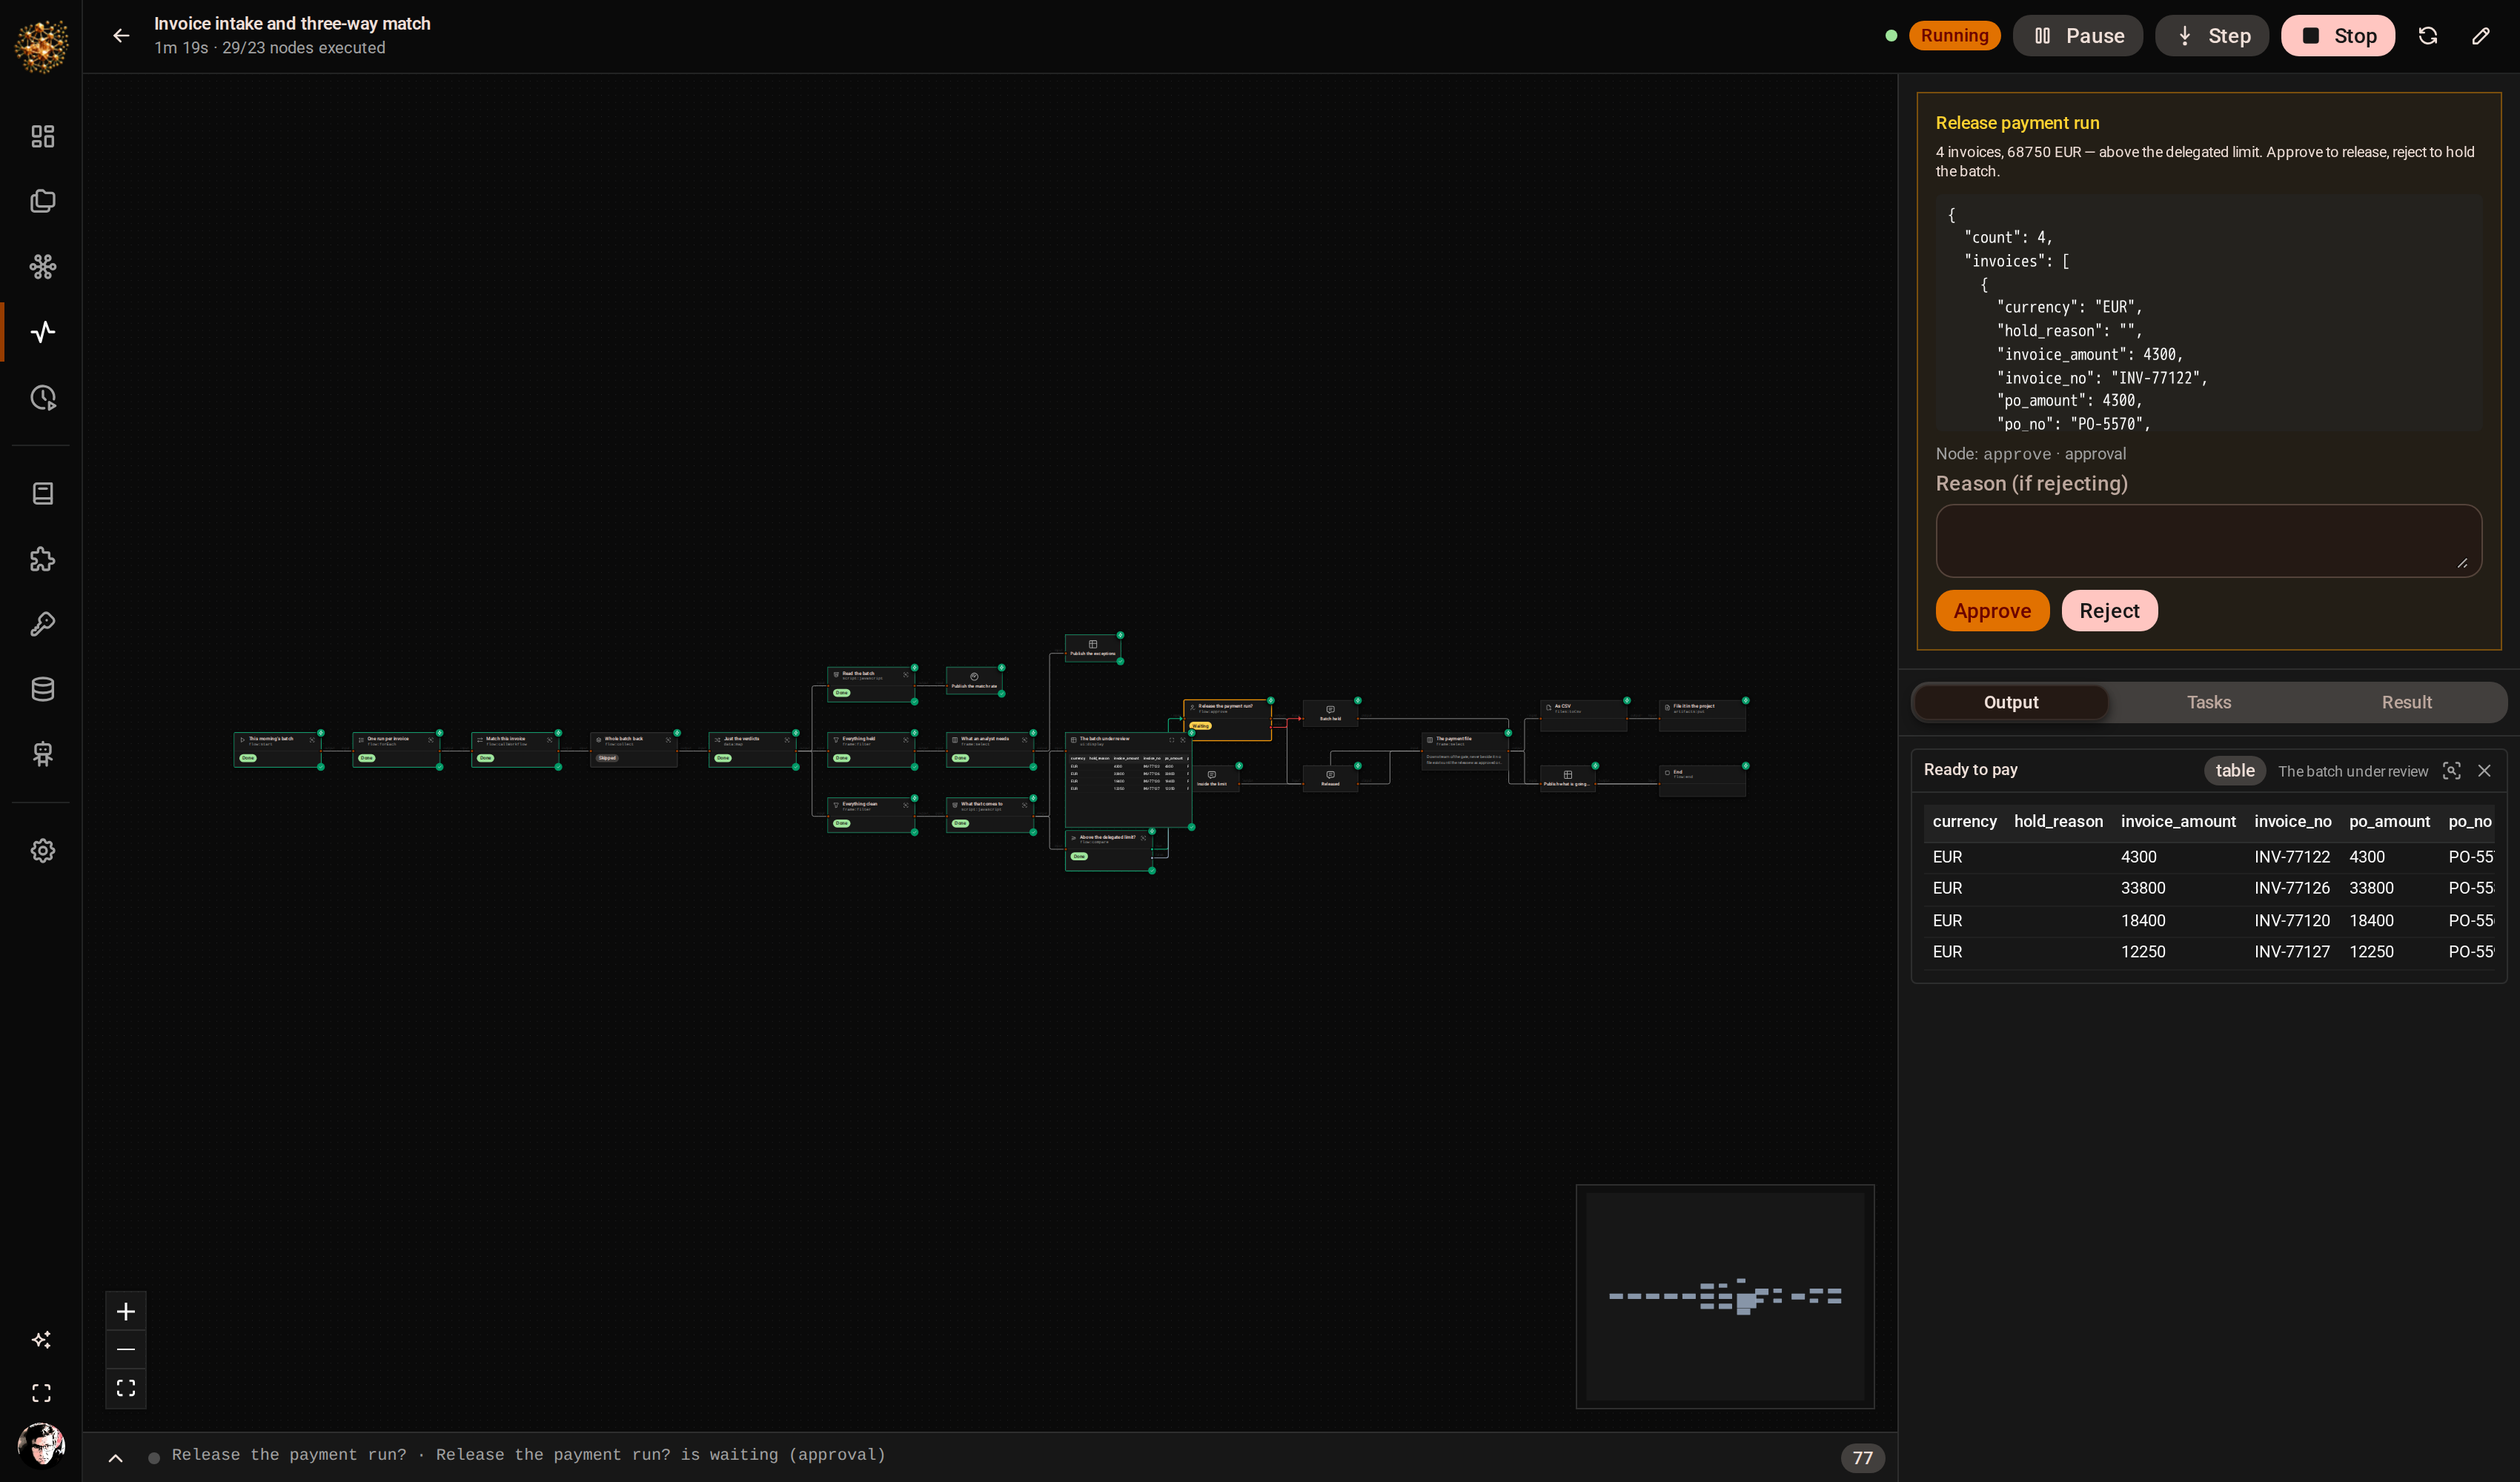
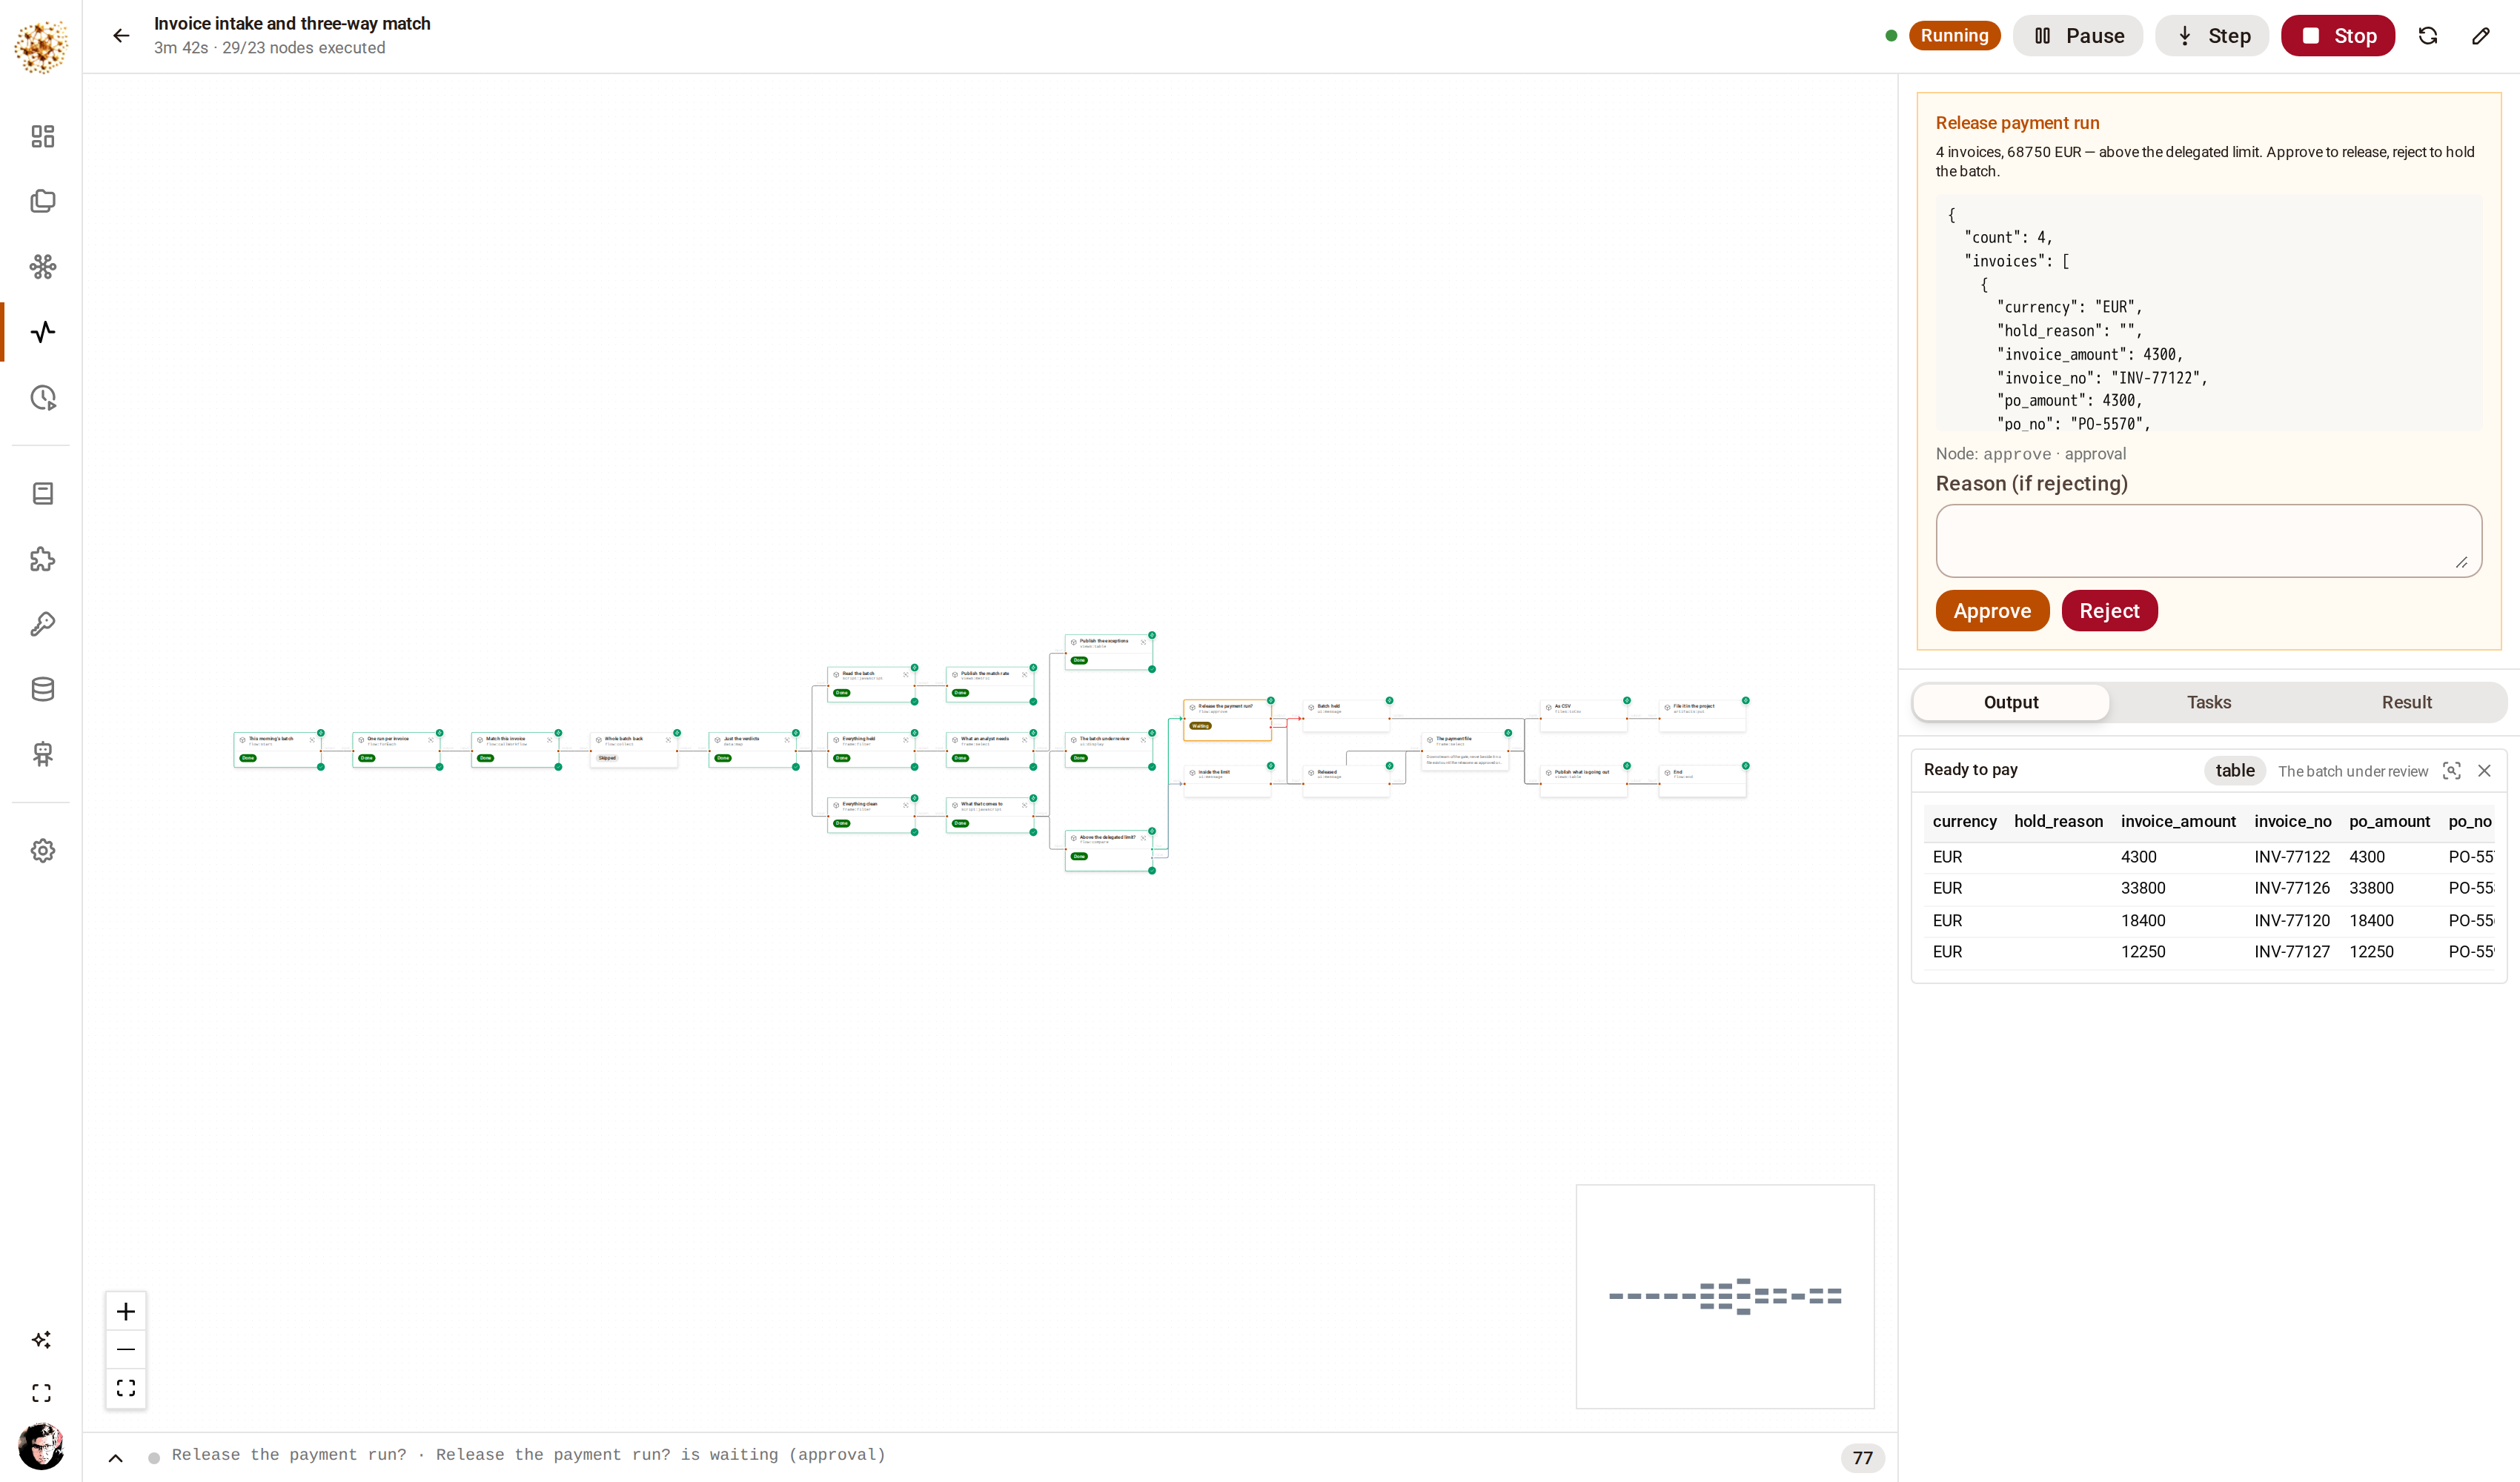
The payment run, stopped in front of a person. Approving it is what writes the payment file; rejecting it writes nothing.Seeded showcase project - SQL · policy in one node · maps
Supply chain
Demand joined to stock in SQL, the reorder policy in one readable node, suppliers graded on what they actually delivered, and every cold-chain excursion on a map.
sql:sqliteQueryframe:*ai:extractviews:mapentities:createEight weeks of demand joined to stock on hand — in SQL, because that is what SQL is for — and then the policy: lead-time demand, safety stock, order multiples, days of cover. That split is the point. The query is a query; the thing a planner argues about is one node they can read. Every line below its reorder point becomes a draft purchase order you can open, and the plan is a page by the time the planner sits down. The scorecard hands the model numbers it did not compute and asks for a recommendation against a schema.
- A join and a group-by in the database, the policy in a node beside it
- A draft order raised per line, as a record in your own ontology
- OTIF and defect rate computed by the graph; the recommended action asked of a model
- Temperature excursions plotted at the point where each one peaked
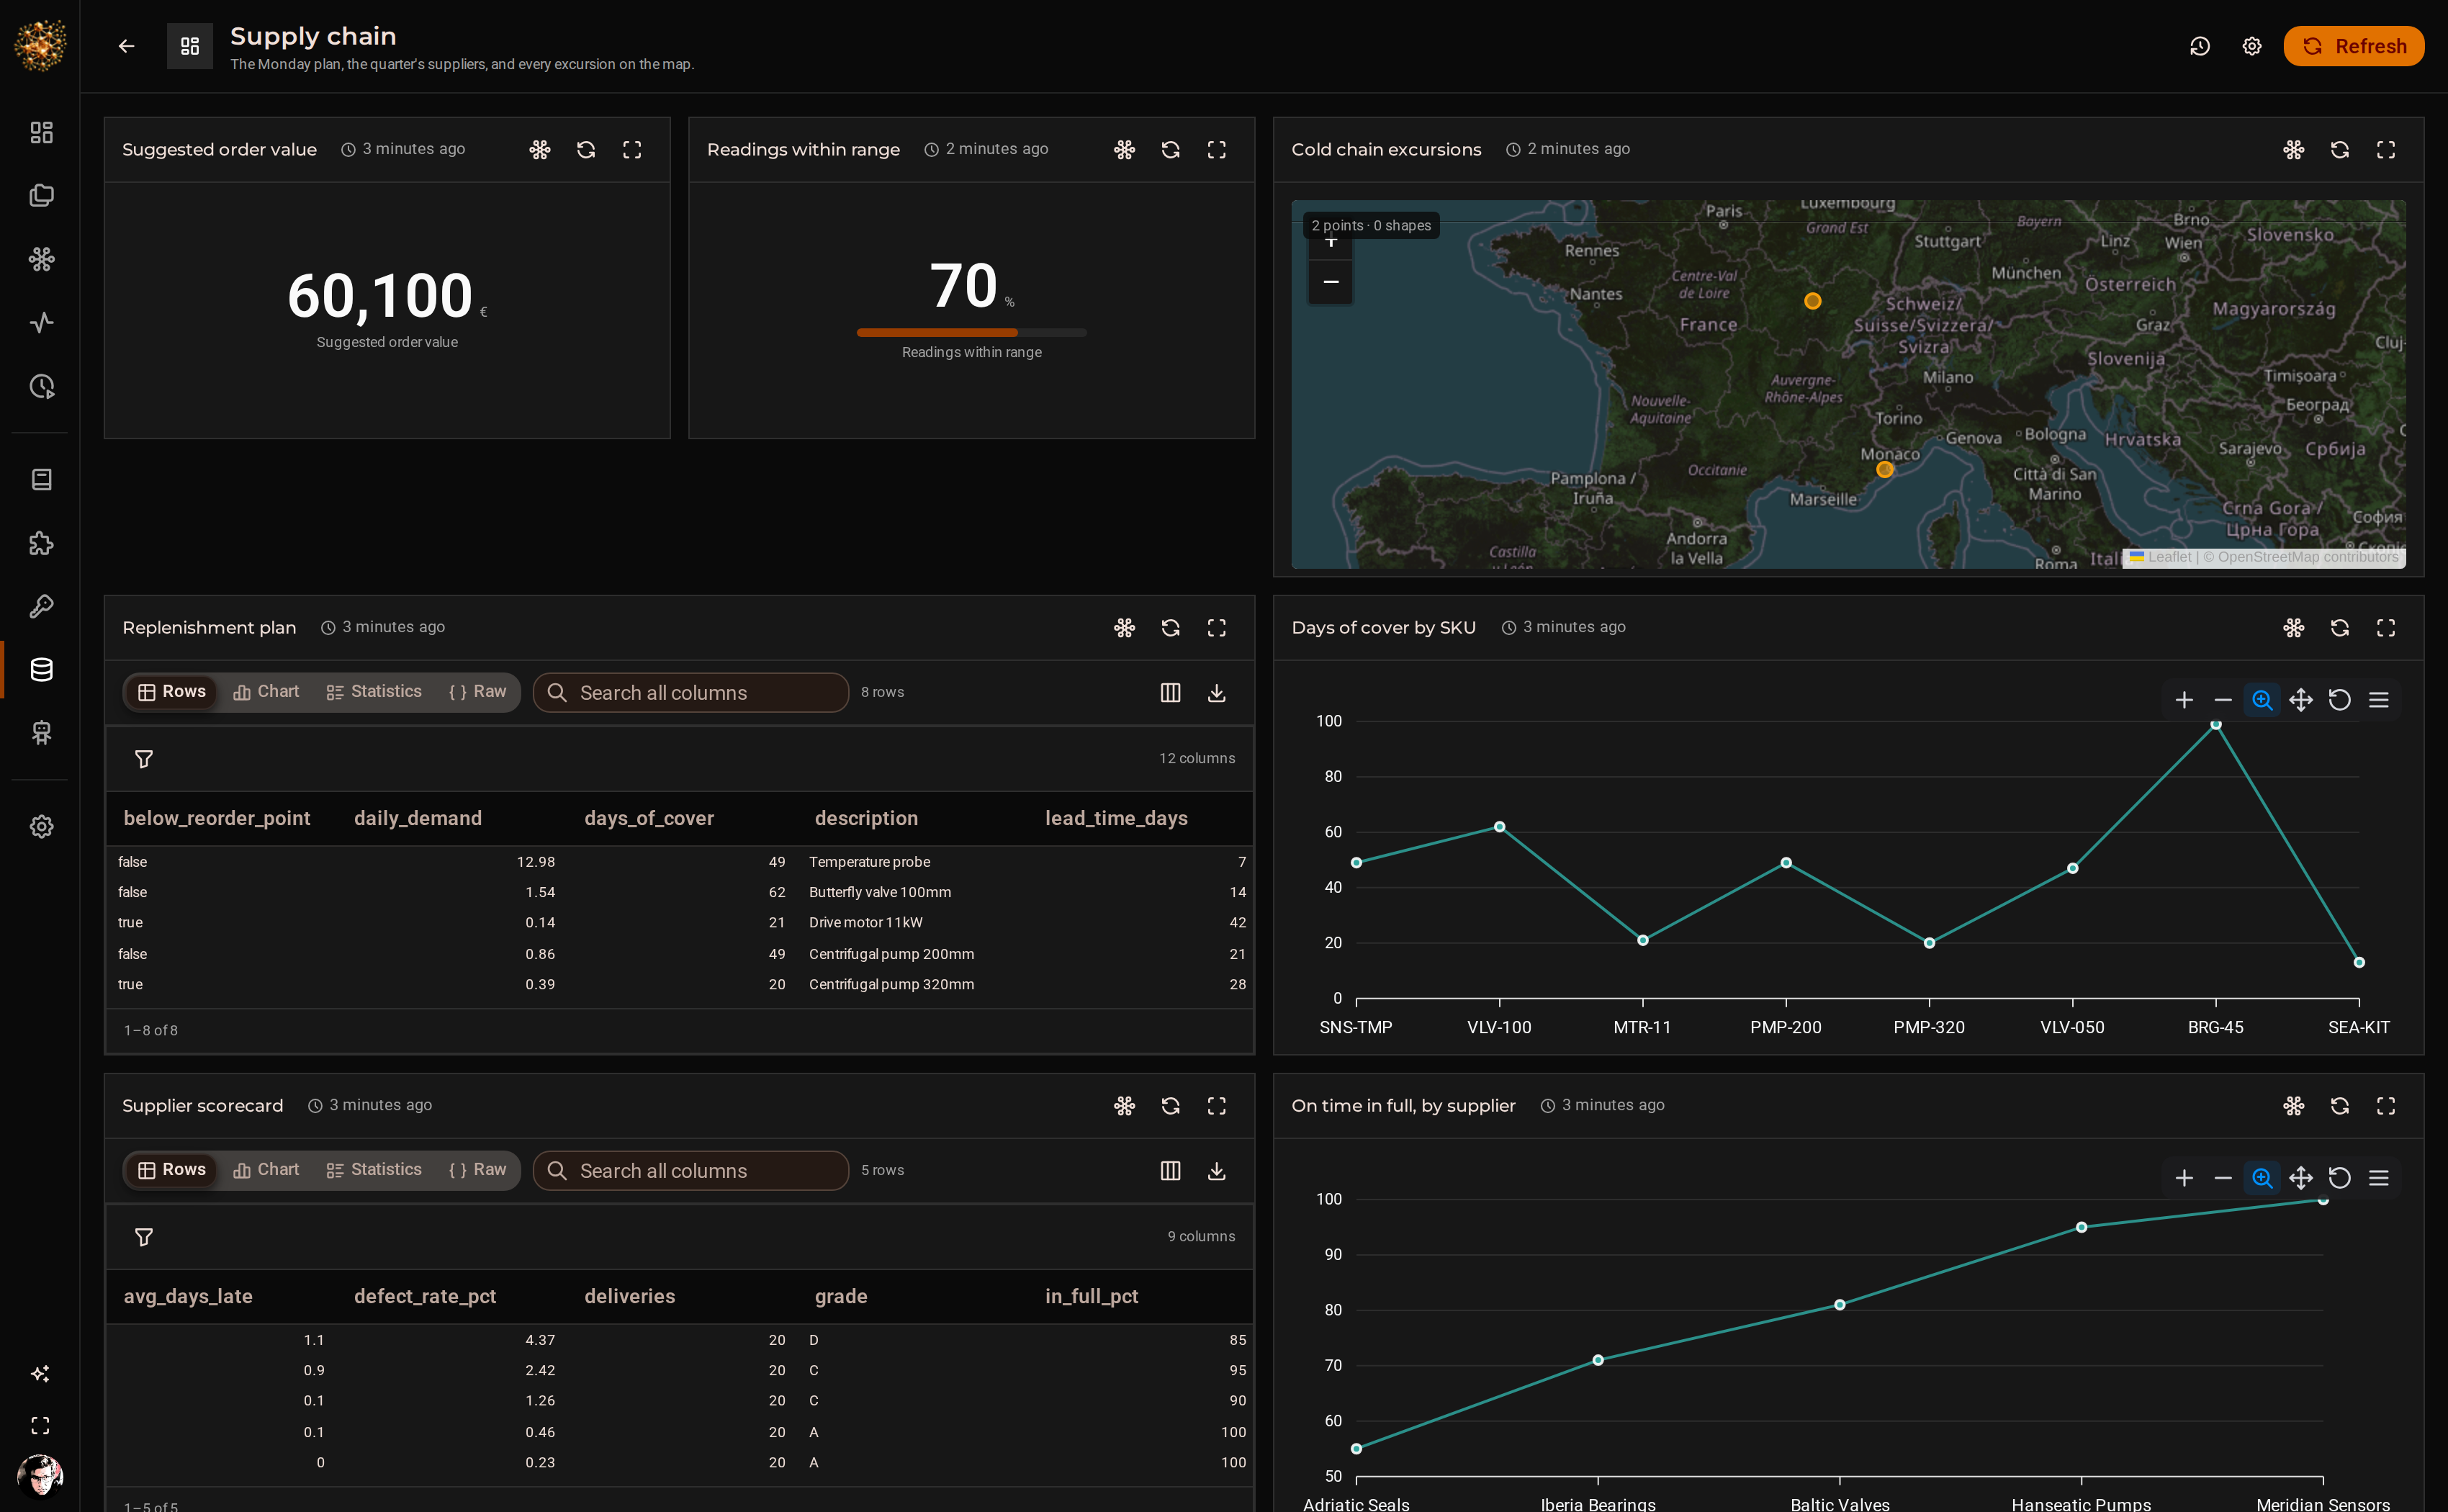
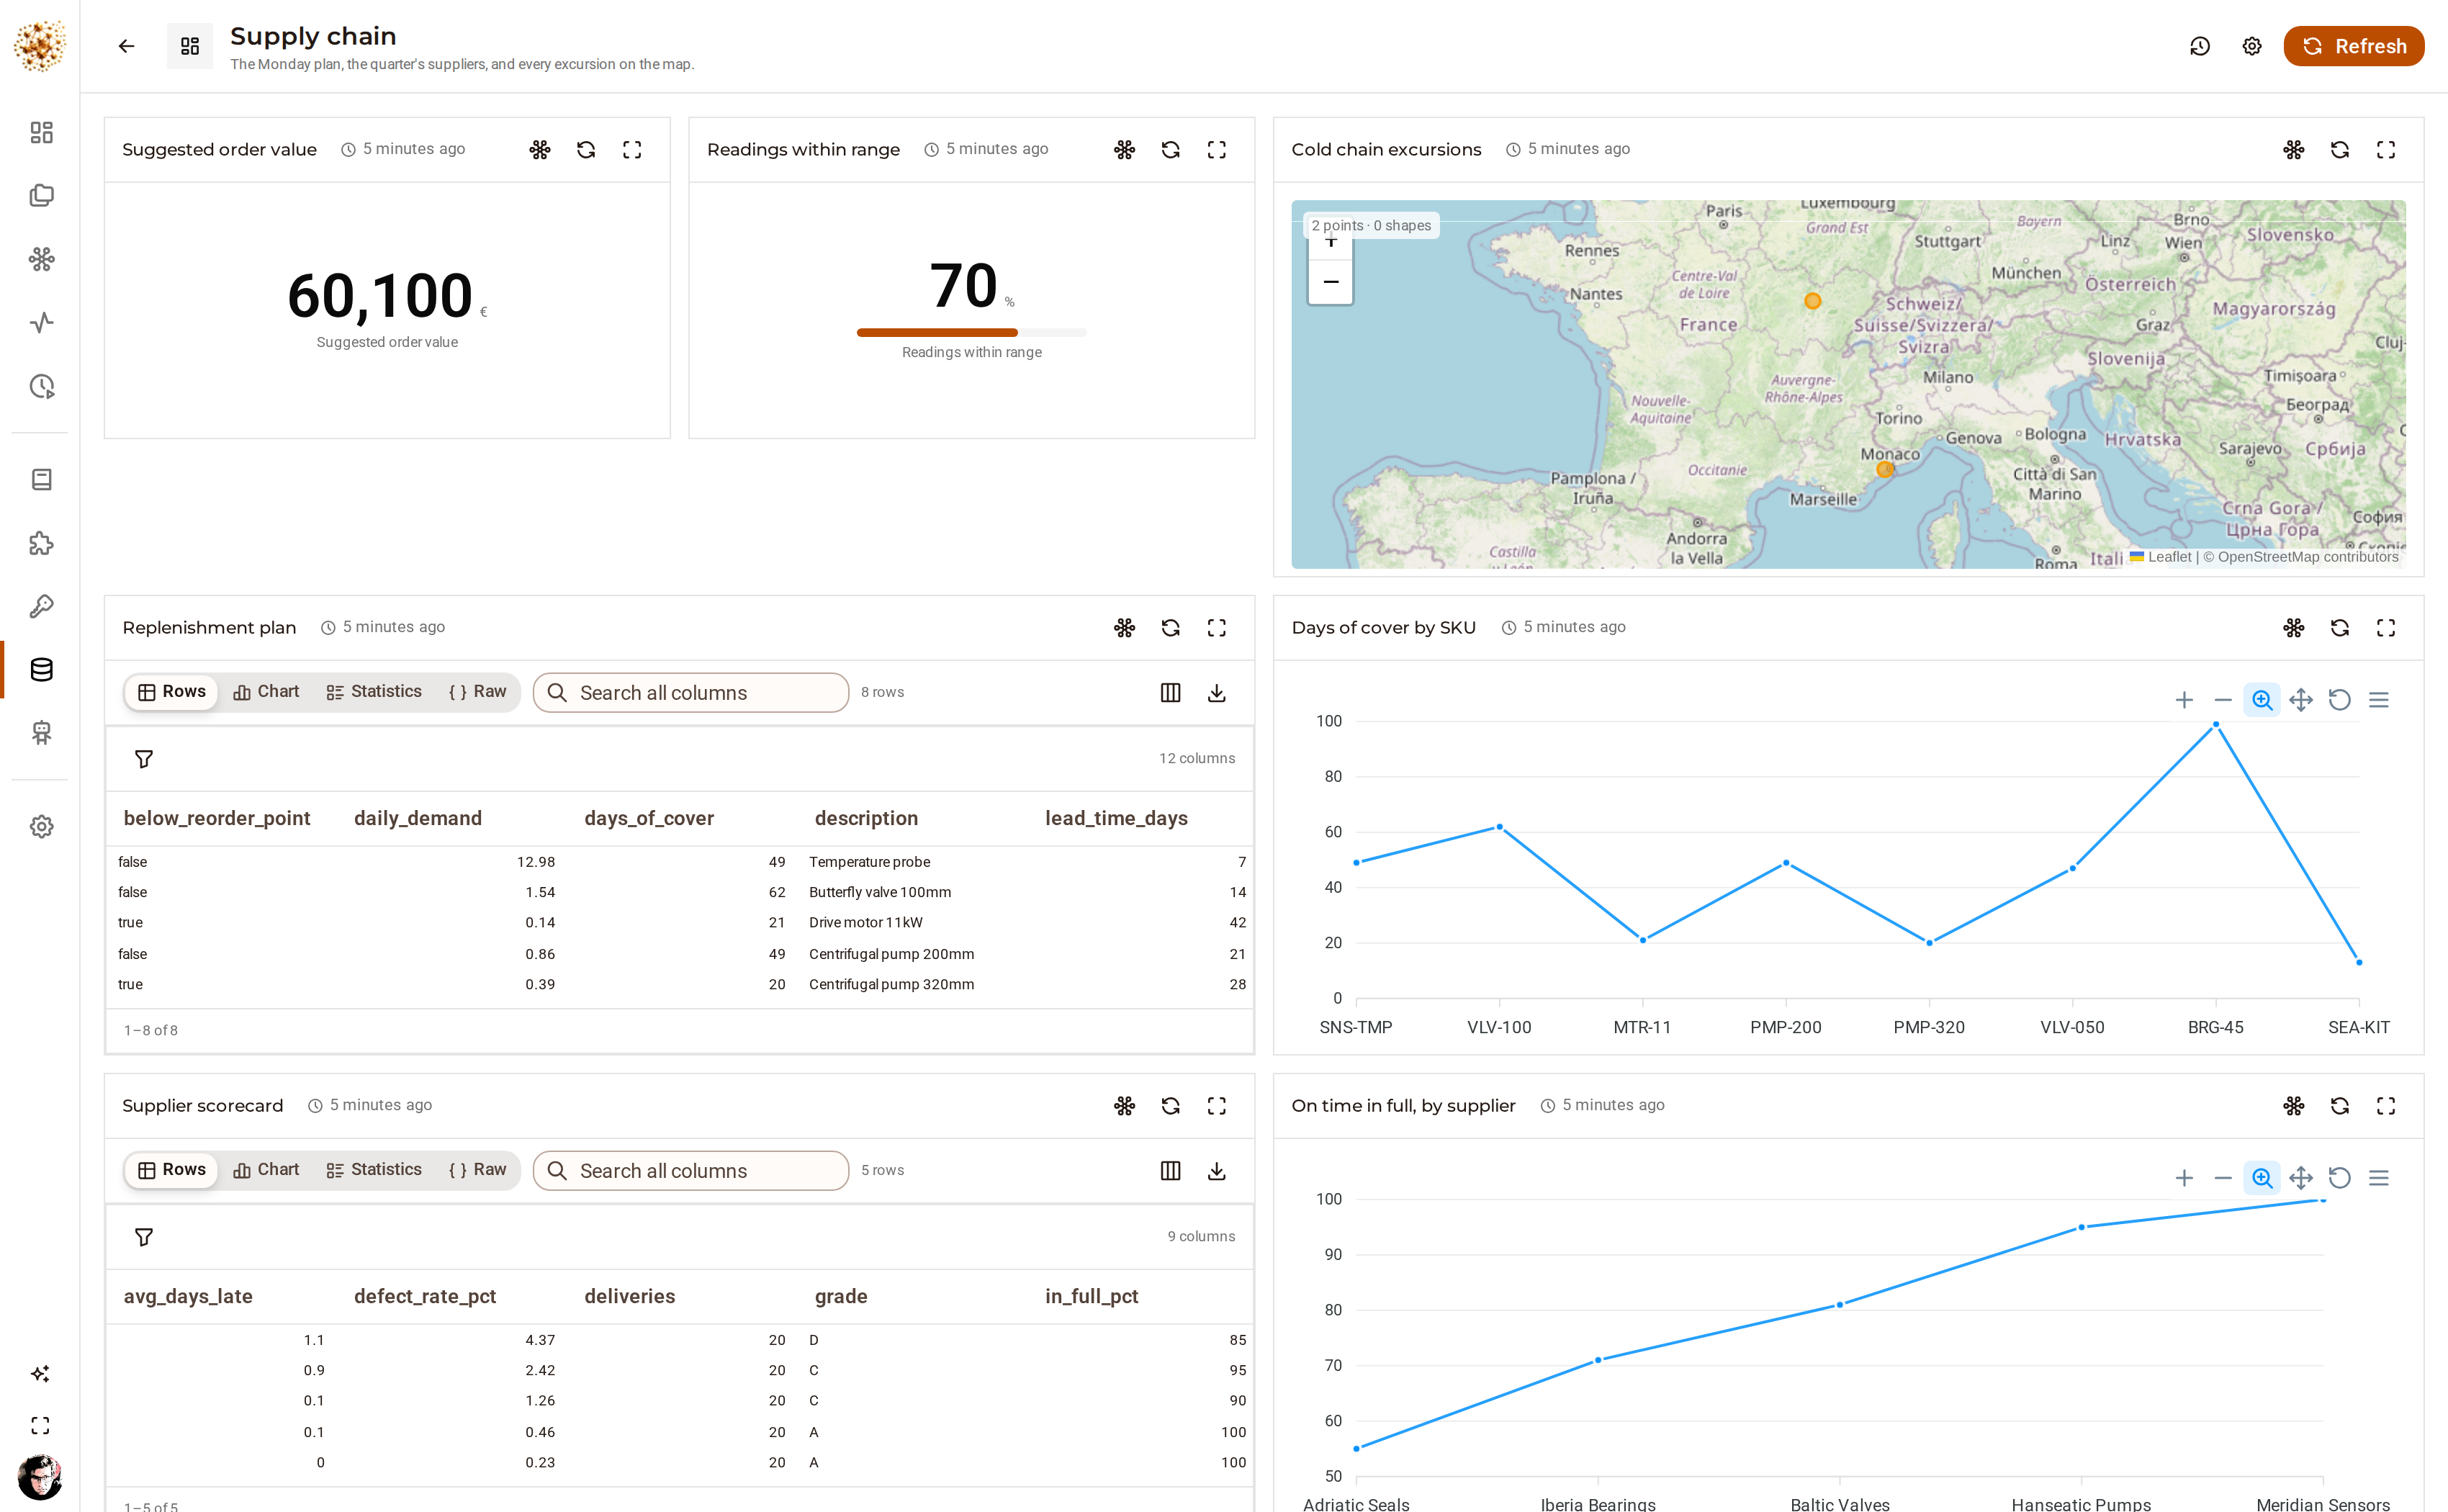
Every excursion at the point where it peaked. The answer to 'where did this go wrong' is a place, and a table of coordinates is not one.Seeded showcase project - Delays · timers · a button on the node
People operations
A fortnight of small tasks with a start date, and three months of check-ins — none of it holding a process open between its moments.
flow:delayflow:intervalui:triggerentities:createviews:*Onboarding is mostly waiting, and most automations of it fire everything on day one because holding a process open for eleven days is expensive. Here it is not: a delay is an event with a future time on it, a repeating check is a timer row, and a run parked on a button costs one row. The probation graph is a single run that spans three months, wakes three times to prompt the manager, and ends itself after the last one. Its period is the only thing a deployment changes.
- Six checklist items fanned out to their owners, each dated back from the start date
- A delay while the equipment order settles — an event with a time on it, not a worker holding still
- A button on the node for 'the desk is ready', because that answer needs no reason attached
- One run, three check-ins, ninety days — armed as a timer row that survives every restart
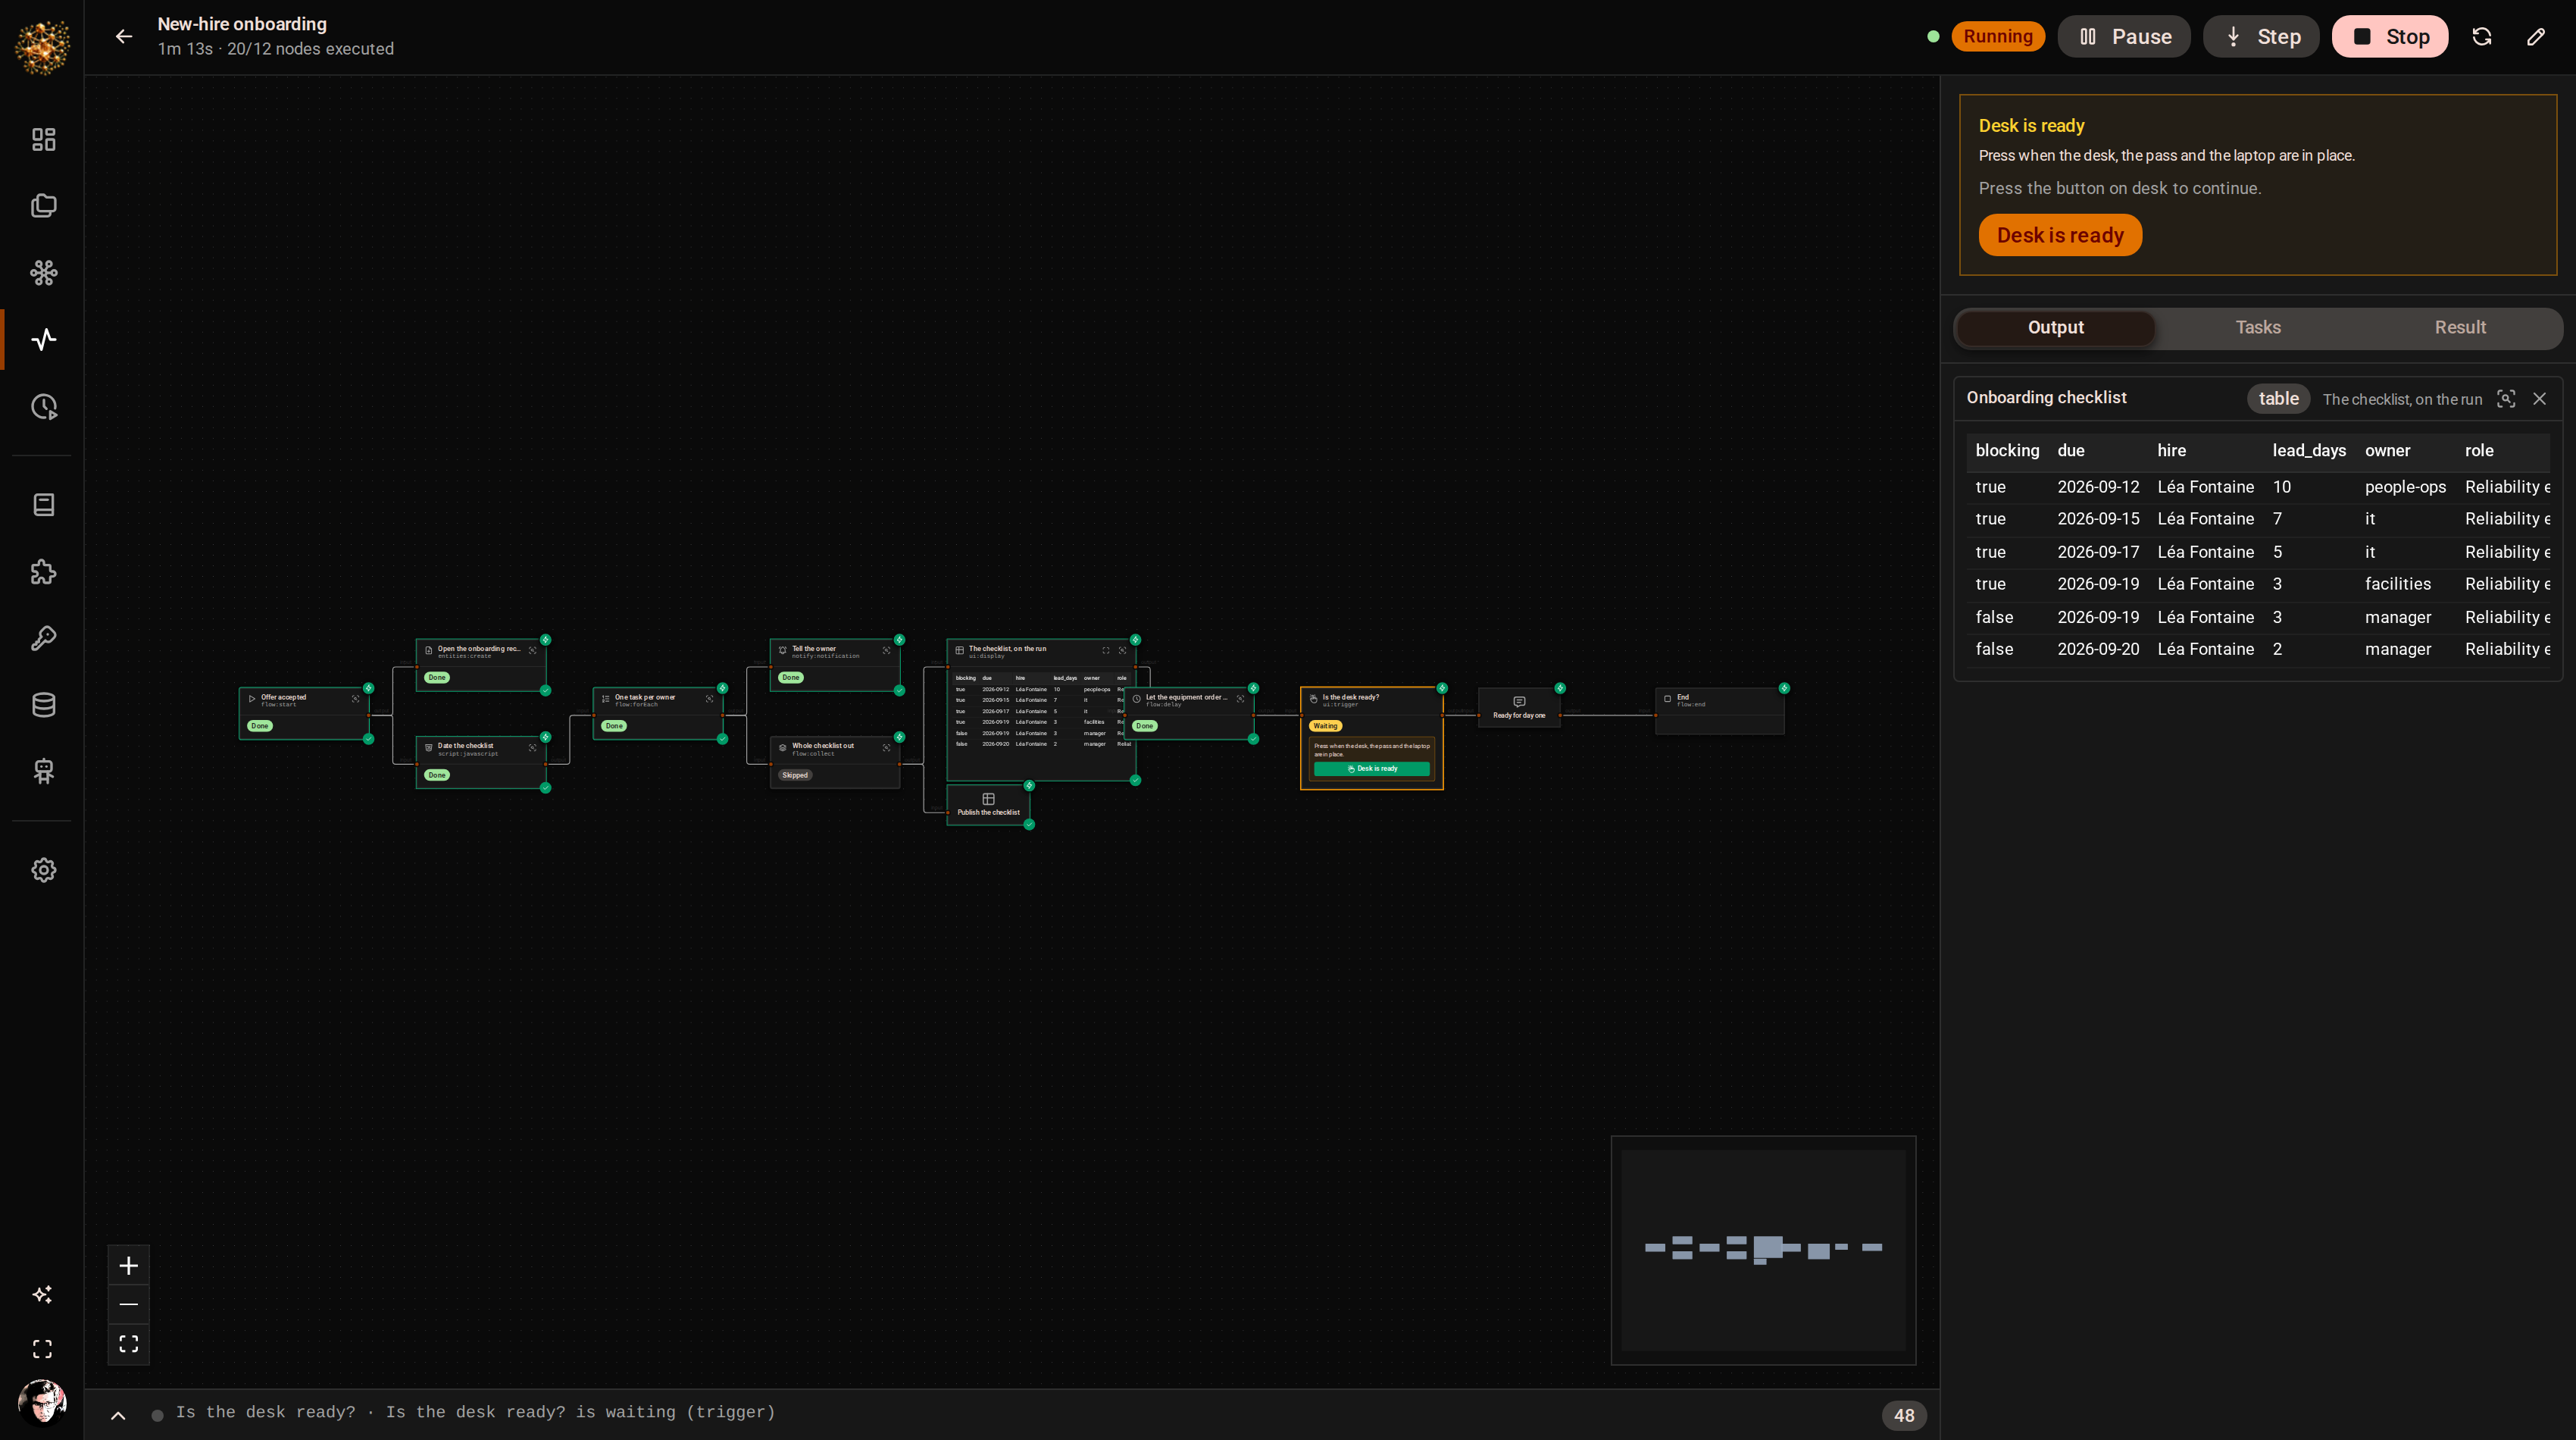
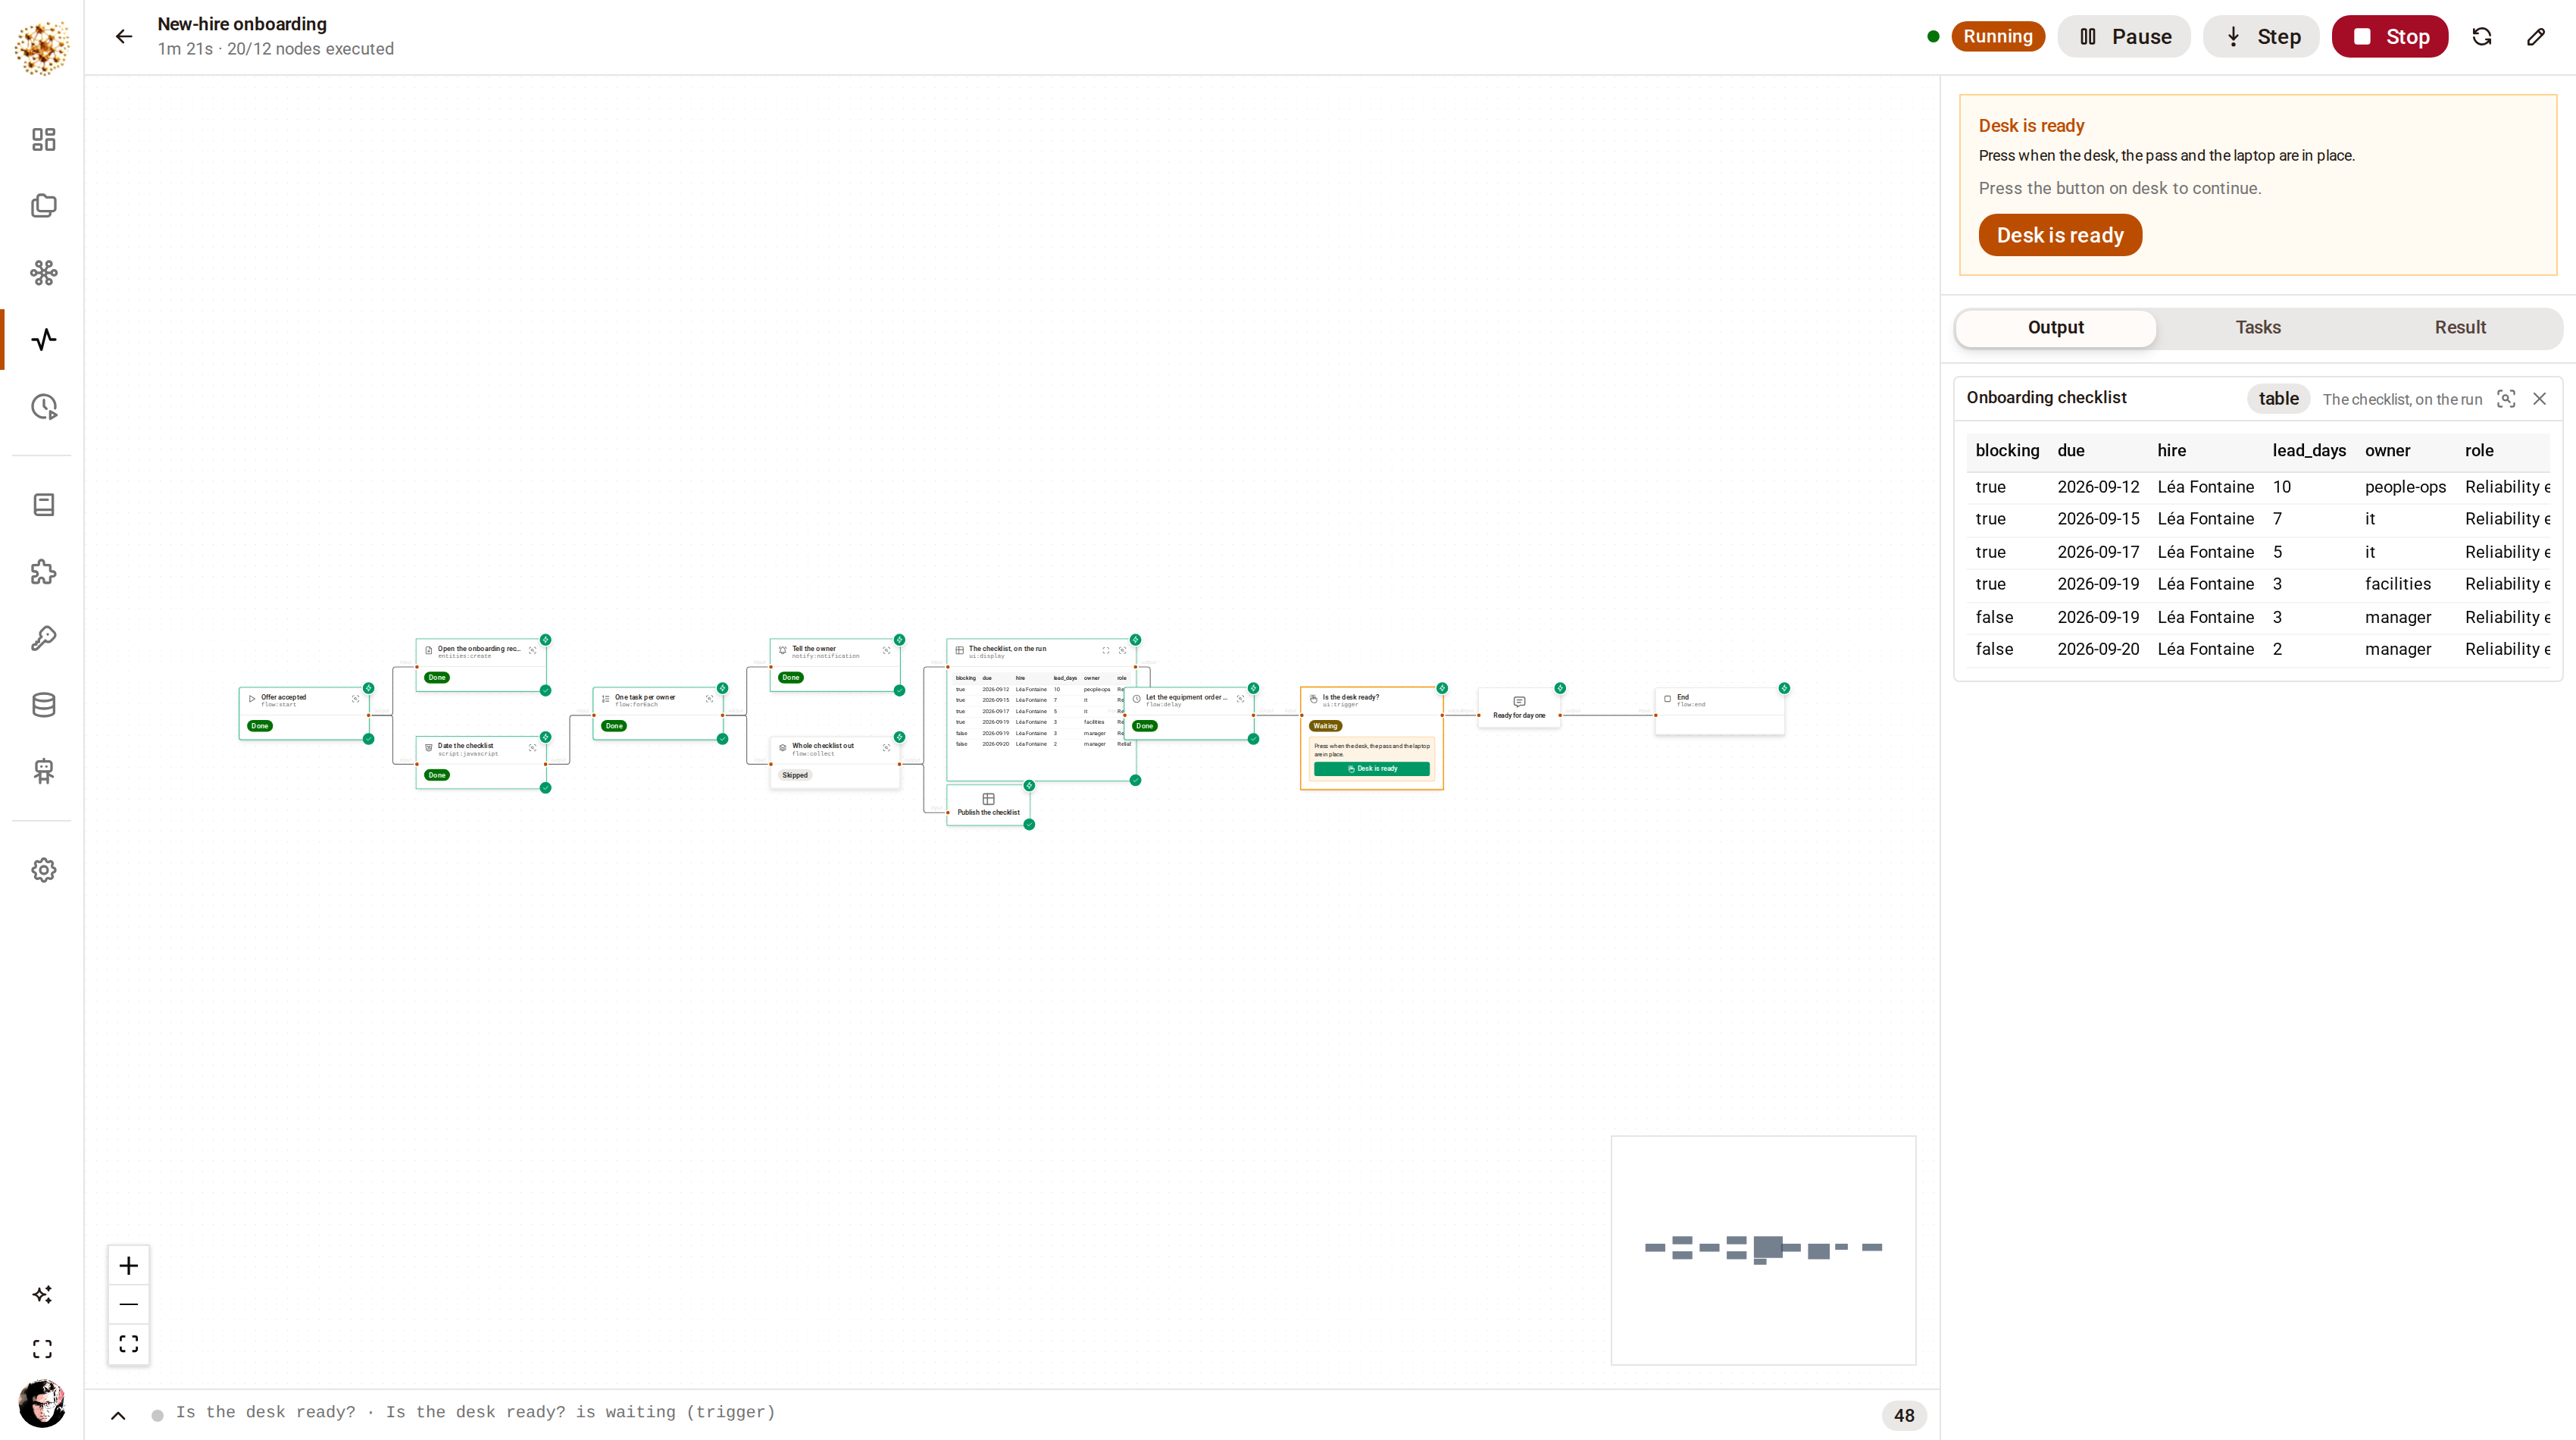
The other kind of human pause: a button on the node, for an answer that is simply 'done'. The run has been waiting for a minute and could wait for a fortnight — it is a row, not a held thread.Seeded showcase project


See it running against your own week
Thirty minutes, your screen or ours. Bring a process you already run by hand — the one with the spreadsheet, the approval and the person who chases it — and we will build it on the canvas while you watch.